
More Exciting Reports Here >
Tradition & Convenience Are Coming Together
The Fast Changing Food Landscape

Four Big Shifts In The Glamour Game

The New Age Of Layering Face Care In India-A Homes
JUl 26
India-A Quarterly
Consumption Pulse
April–June 2026
Executive Synopsis: The Q2’26 Consumption Story
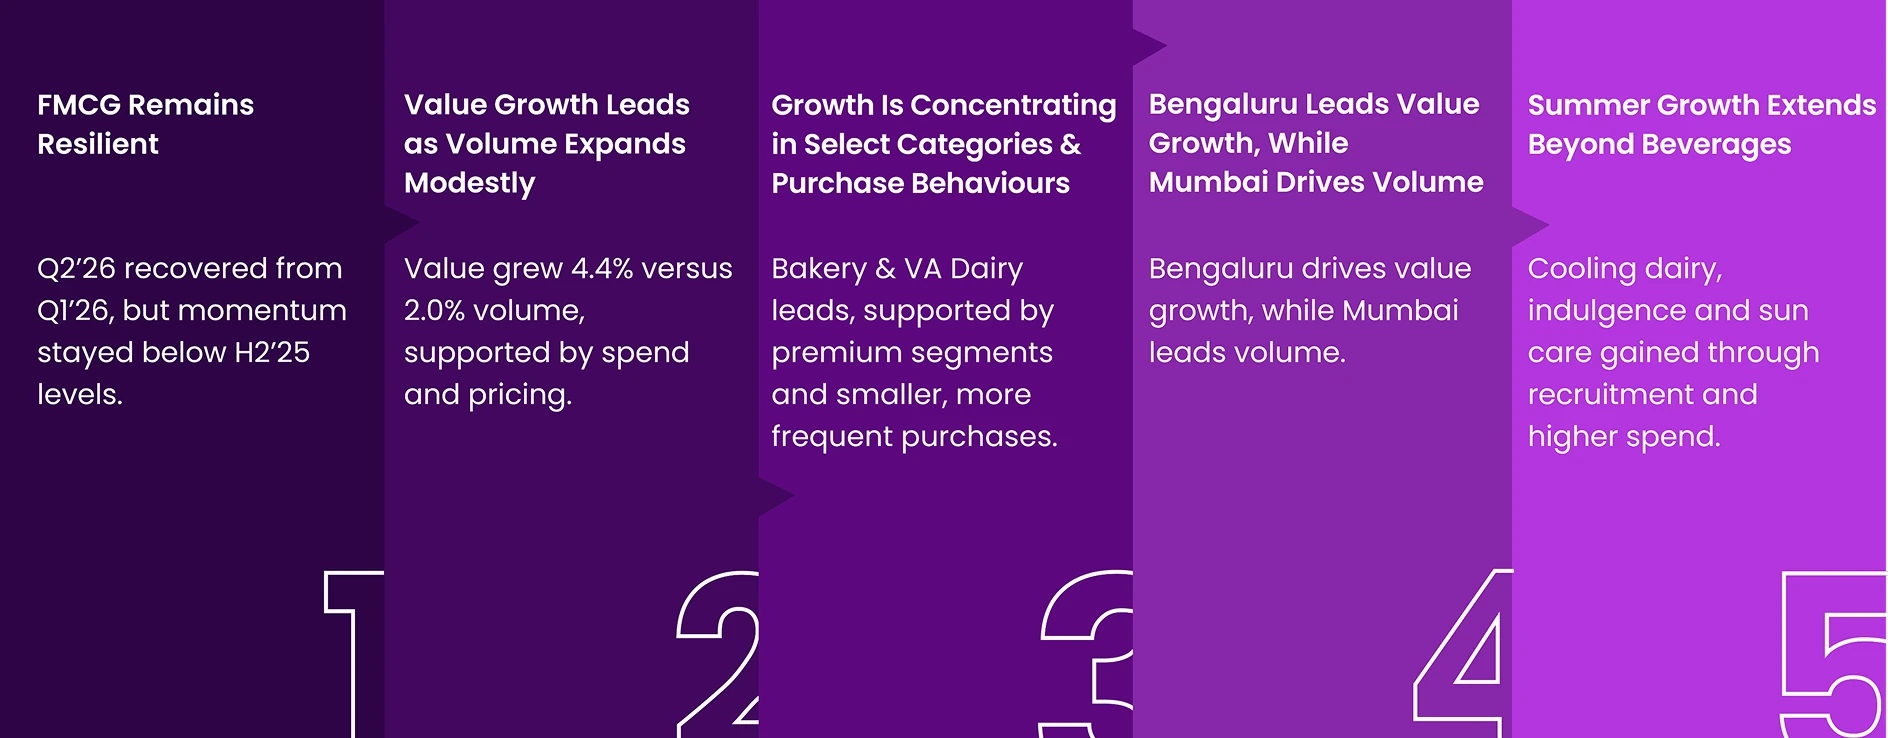
Q2 '26 underscores the resilience of India-A’s FMCG market, with value growth holding firm despite heightened geopolitical uncertainty. Growth was concentrated in Bakery & VA Dairy, Staples, Beverages and Wellness, while performance varied sharply by metro and season. Bengaluru led value growth, Mumbai drove volume, and summer demand created distinct opportunities across refreshment, cooling dairy, indulgence and seasonal personal care.
Key Insights

01
Growth Moderates,
But Remains
Resilient
Higher Spend and Price Drive
FMCG Value as Household
Consumption Holds
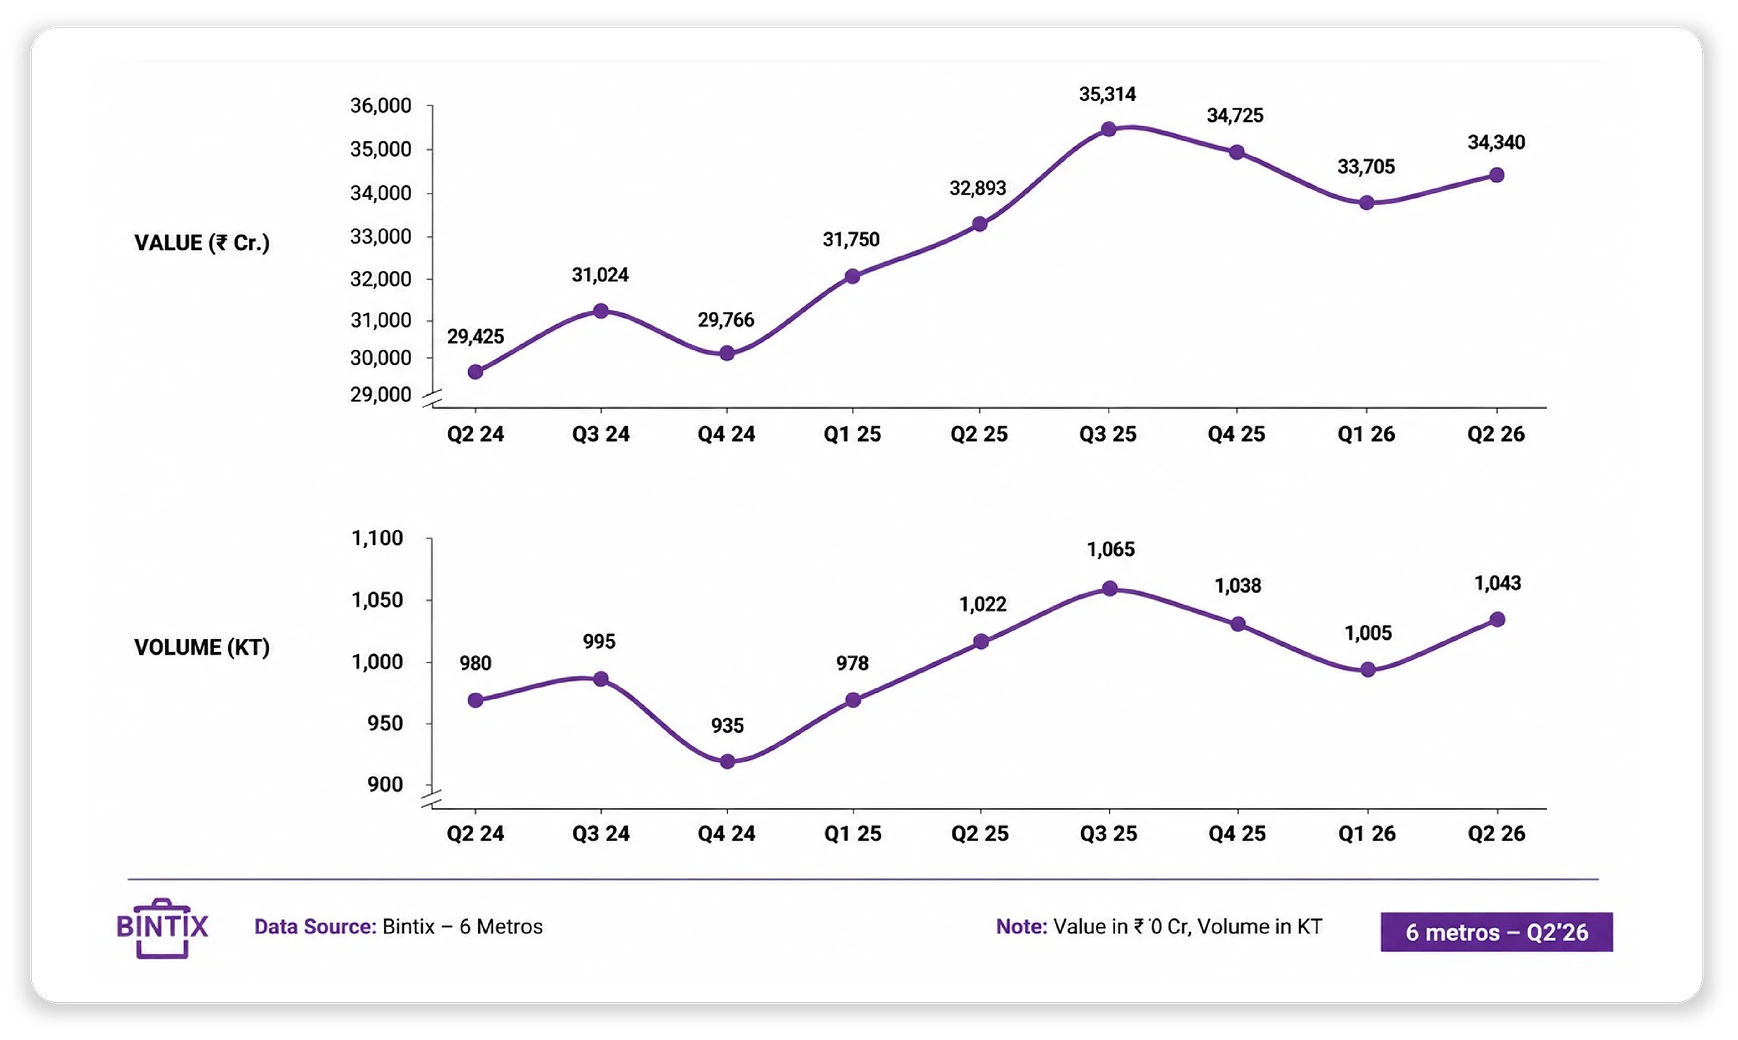
FMCG value grew 4.4% and volume rose 2.0% compared with Q2’25. The volume increase largely reflects the 2.6% growth in the metro population, while average consumption per household slightly declined. Higher average spend and price growth supported the value uplift.
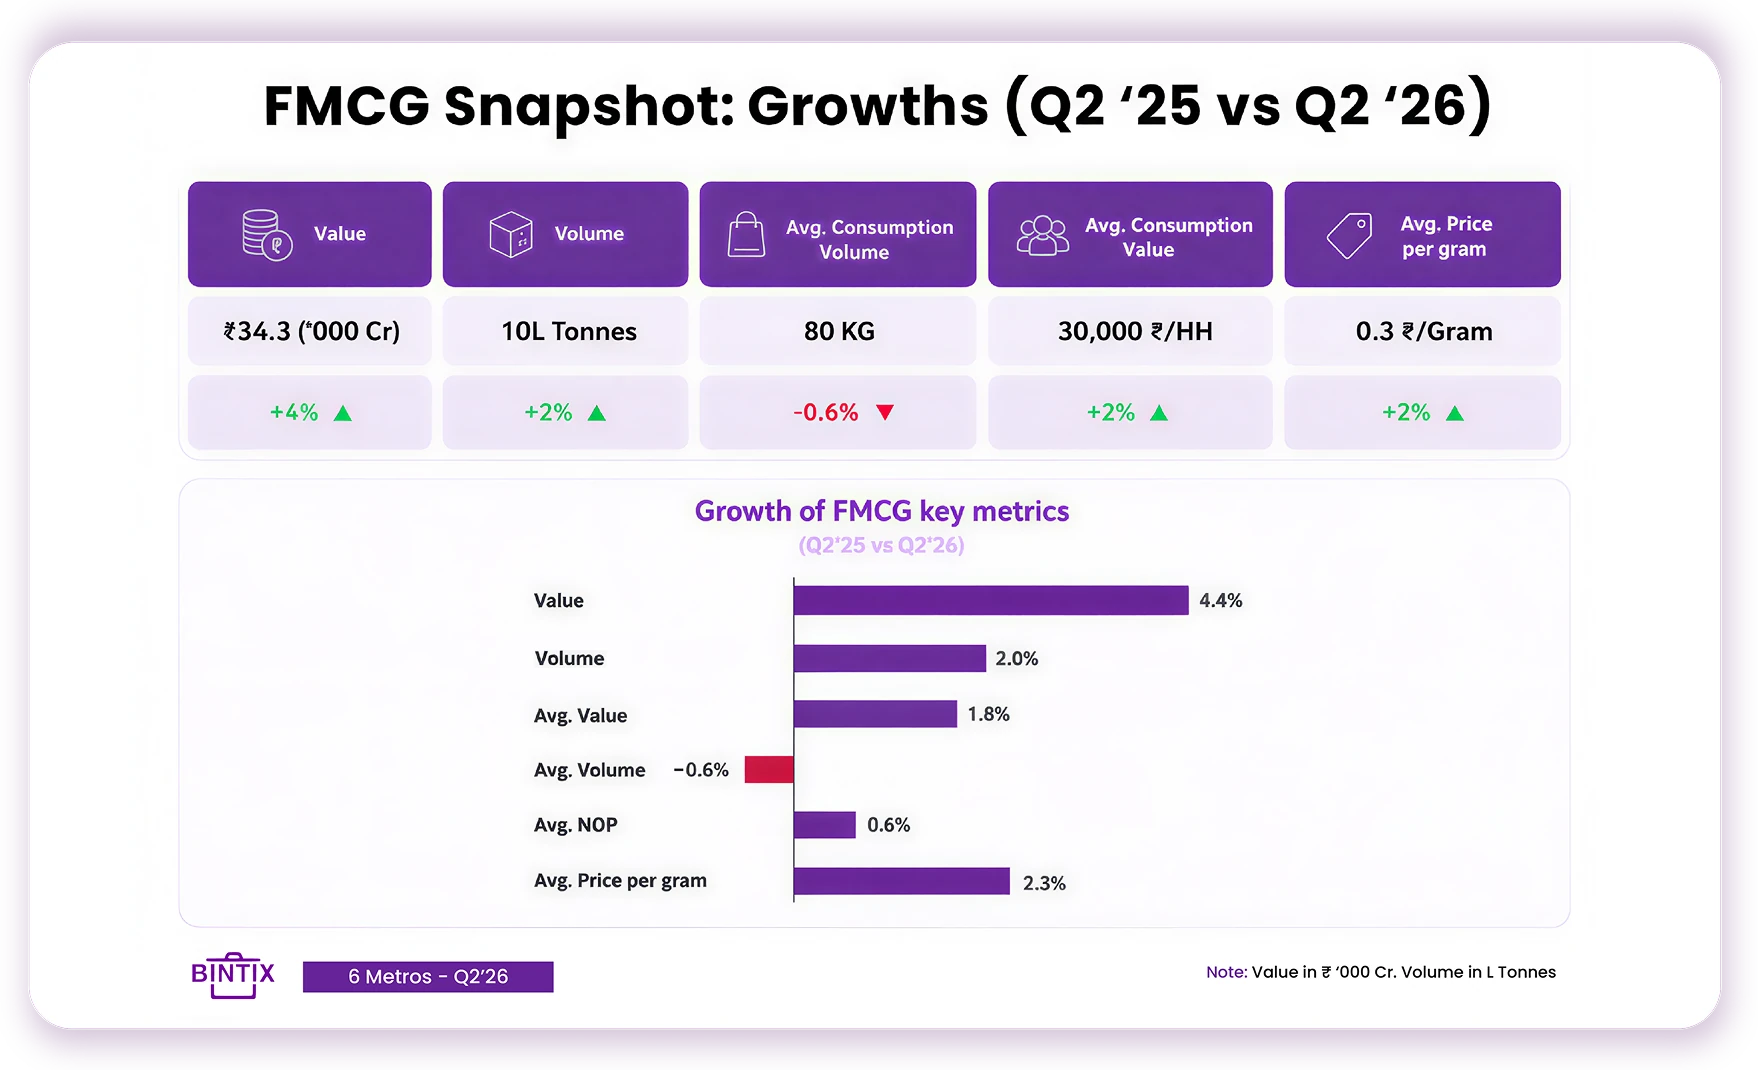
Q2 ’26 improved from the dip seen in Q1 ’26, with FMCG value moving back above Q2 ’25 levels. However, it remains below the stronger levels recorded in the second half of 2025, indicating a positive but still measured recovery.

02
Share Of Wallet
Staples Continue to Anchor
the Basket as Wellness
and Bakery & VA Dairy
Gain Relevance
Staples, Personal Care and Snacks continue to dominate household FMCG spending, while growth is shifting towards Wellness and Bakery & VA Dairy, signalling gradual reallocation of spend towards health, convenience and lifestyle-led consumption.
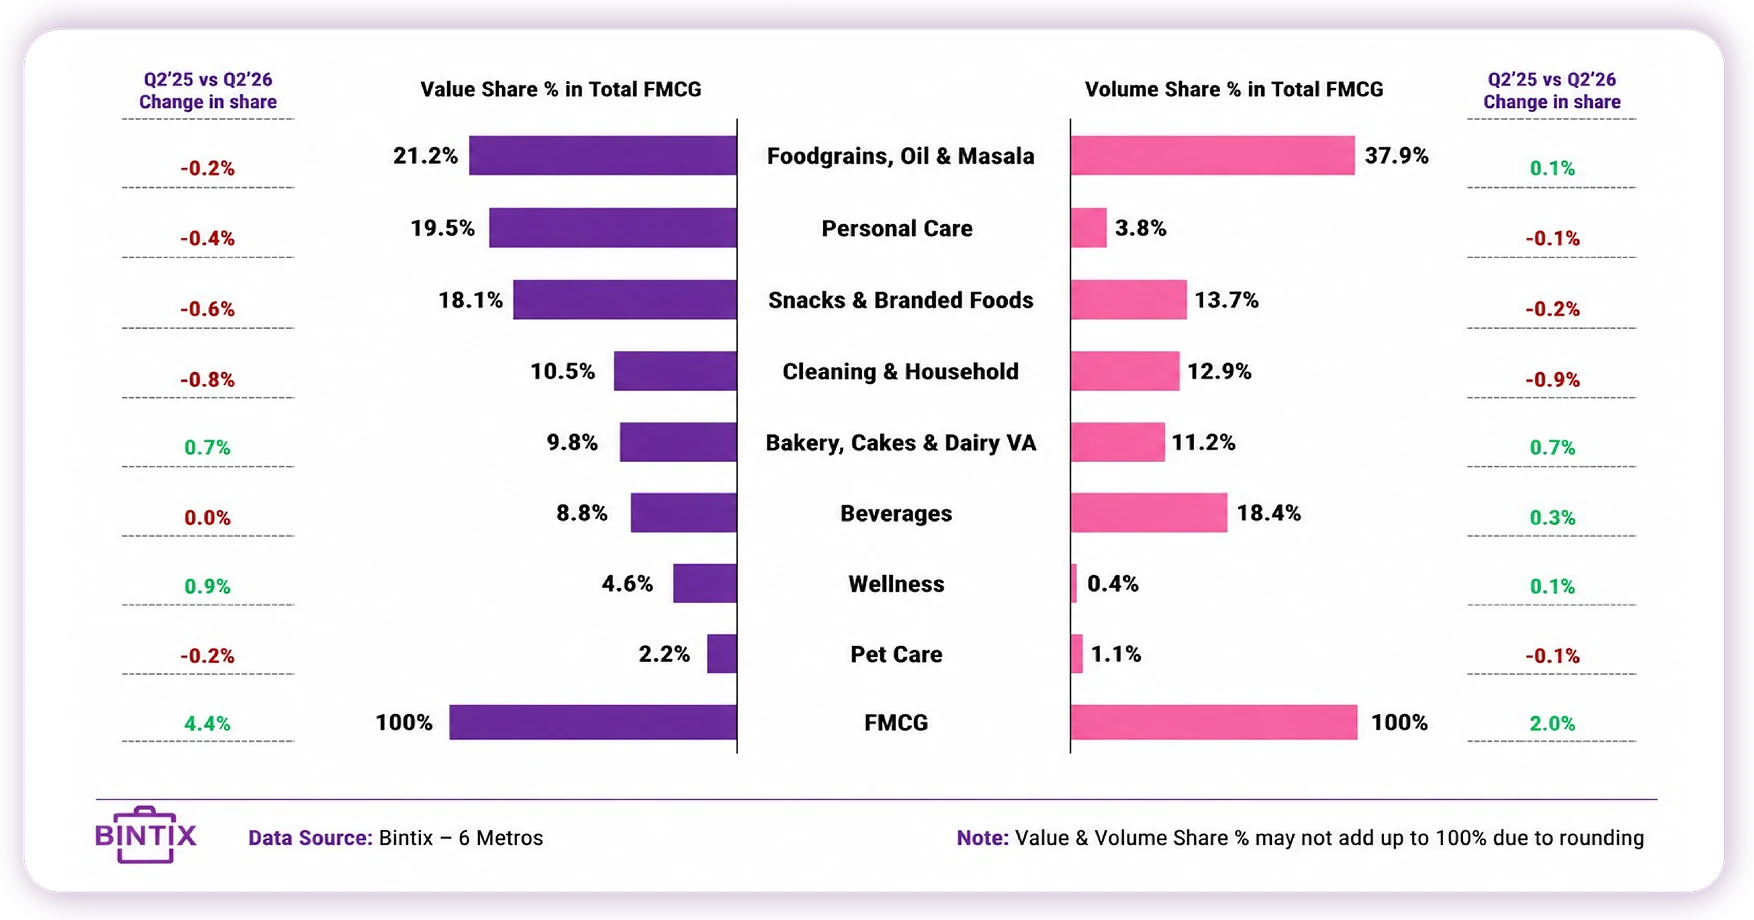
Wellness (+28%) and Bakery & VA Dairy (+13%) are the fastest-growing expenditure baskets and continue to gain wallet share, while Snacks, Home Care and Personal Care are losing share—pointing to a gradual shift in household spending priorities.
Avg. Monthly Spending By Key Super Categories : Q2 ‘26
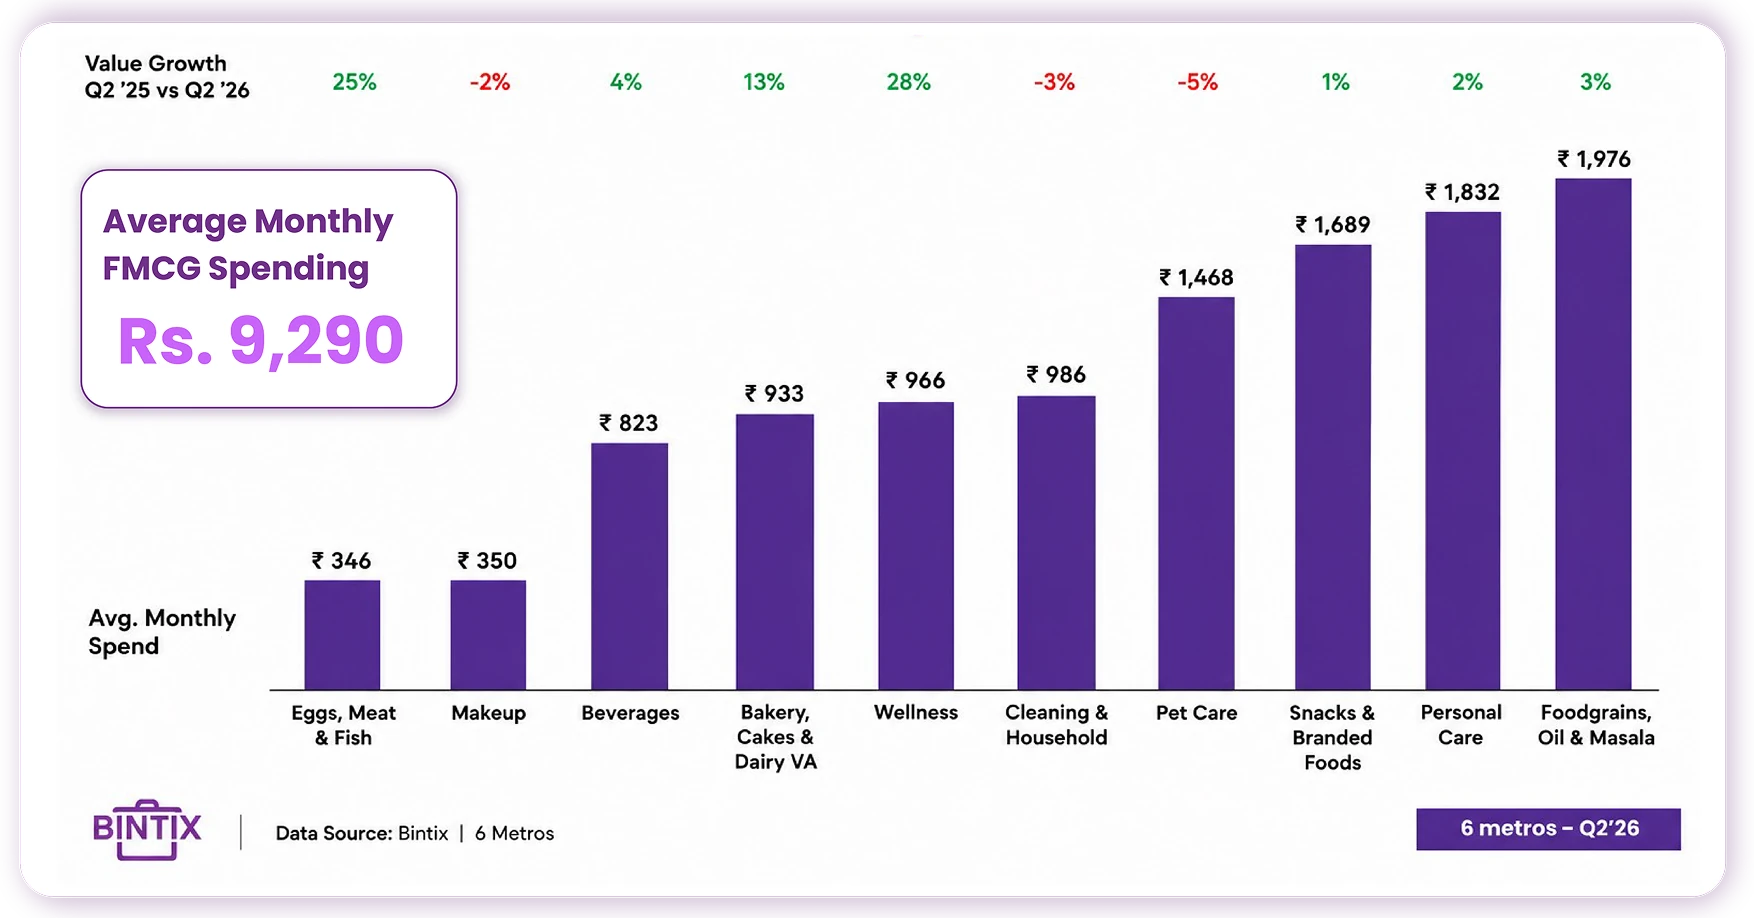
Wallet share is gradually shifting towards Wellness and Bakery & VA Dairy, while Snacks, Home Care and Personal Care lose ground, signalling a change in spending priorities.
Value & Volume Share (%) In Total FMCG By Super Categories : Q2 ‘26

03
Category Momentum
Growth Is Concentrated
in a Select Set
of Categories
FMCG Value Growth & Super Category Performance : Q2 ‘25 - Q2 ‘26
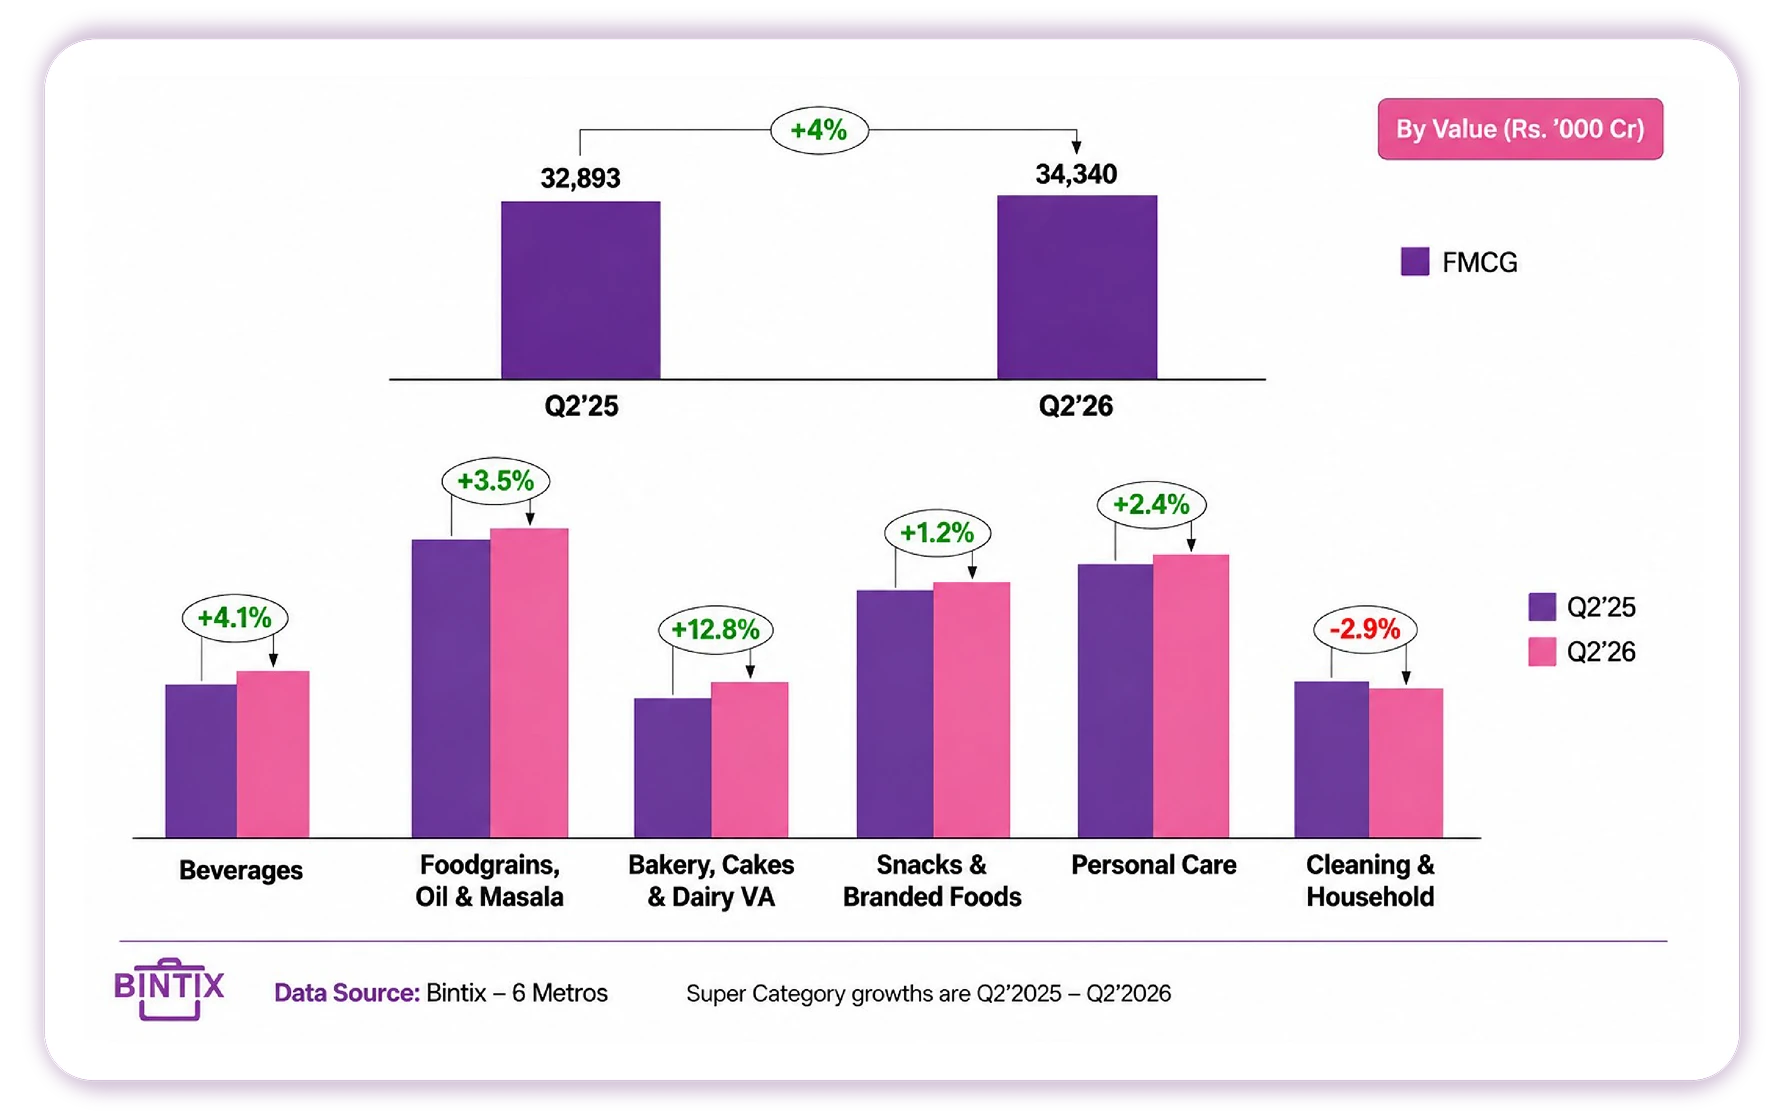
FMCG growth remains uneven across the basket, with momentum concentrated in a limited number of categories.
Bakery & VA Dairy led value growth, followed by Beverages and Staples, while Personal Care and Snacks grew moderately and Home Care remained under pressure.
FMCG Volume Growth & Super Category Performance : Q2 ‘25 - Q2 ‘26
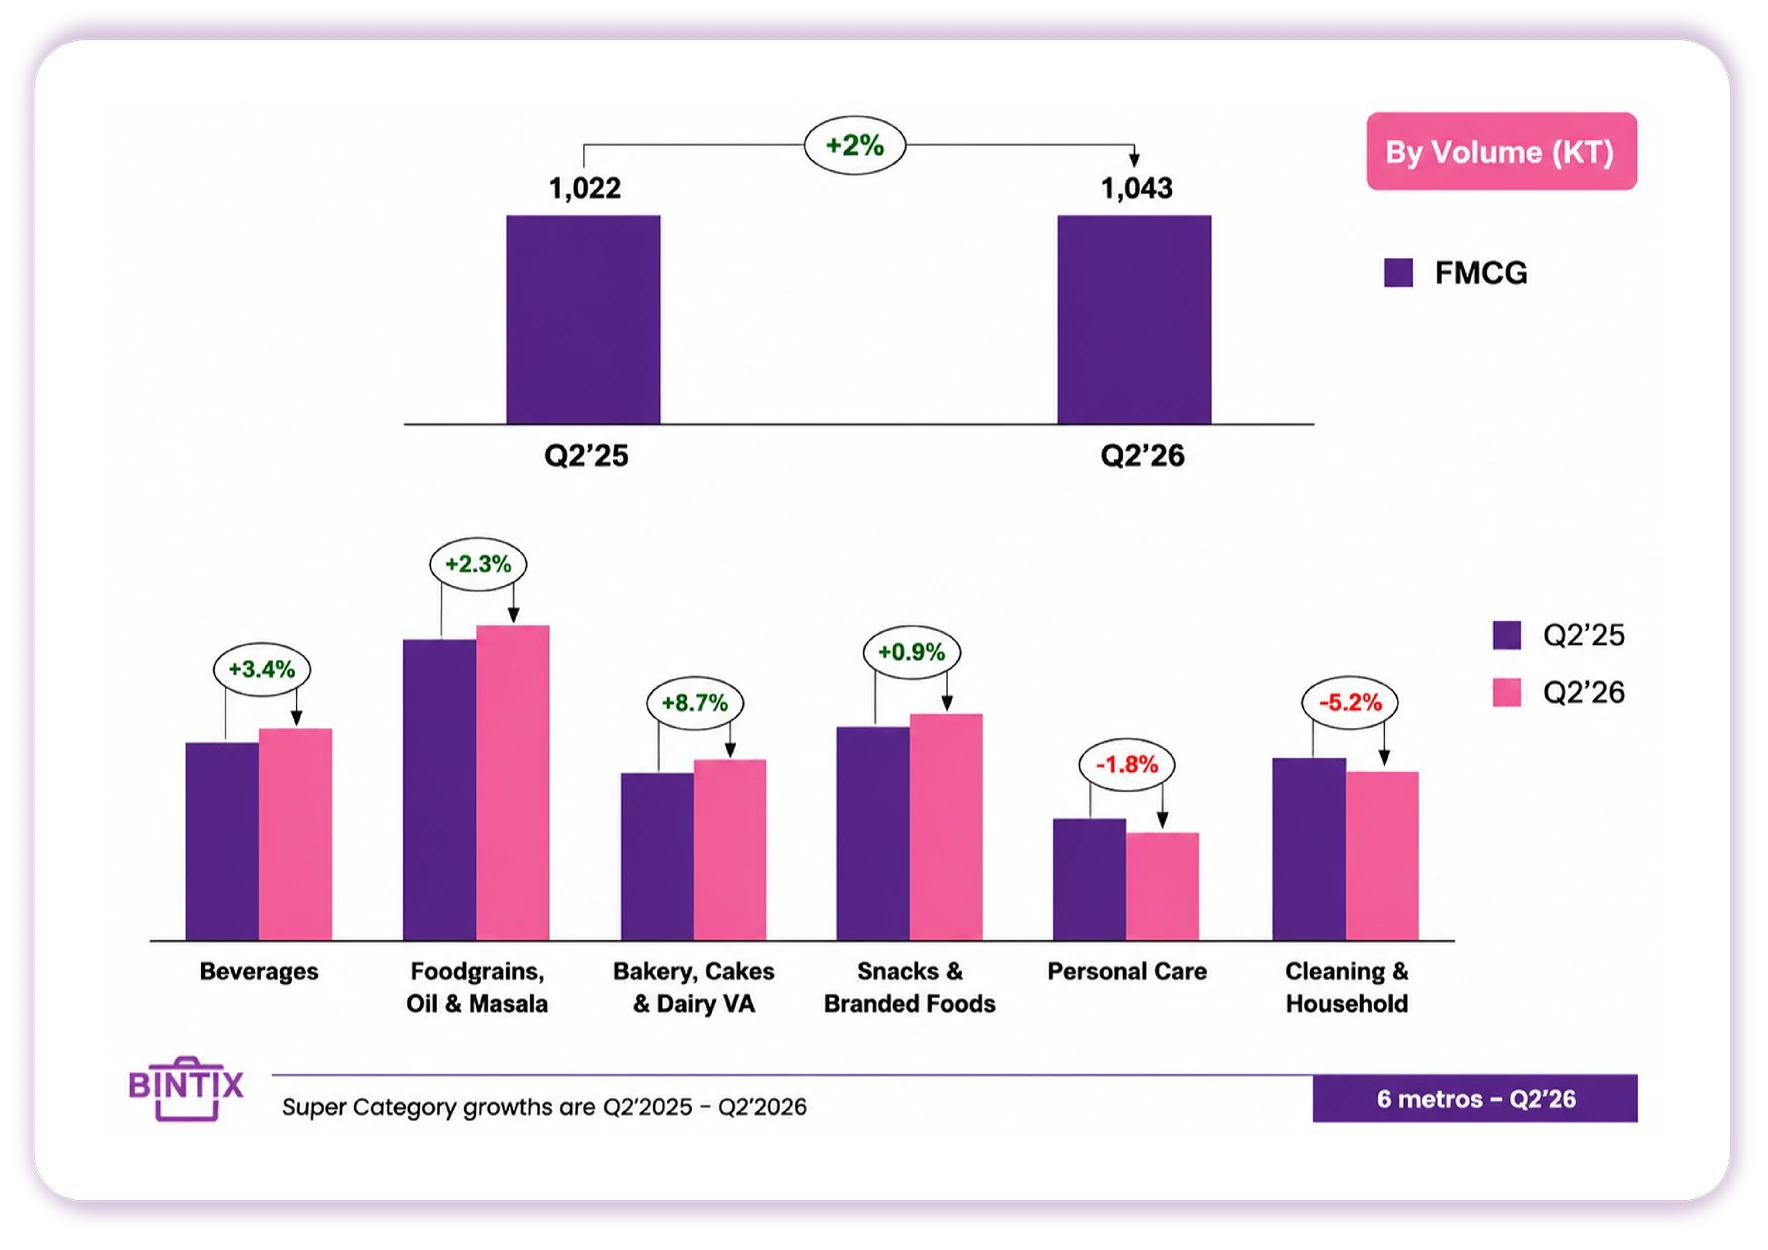
Bakery & VA Dairy also led volume growth, followed by Beverages and Staples. Snacks recorded modest gains, while Personal Care and Home Care declined.

04
Q2’26 Emerging
Consumption Themes
Health, Convenience
and Specialised Formats
Are Driving Segment Growth
While broad category momentum remains selective, several niche segments are expanding much faster than their parent categories. Premium, convenience-led and health-oriented propositions continue to drive some of the strongest gains in both household recruitment and value growth.
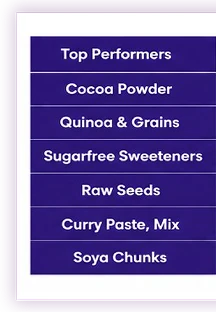
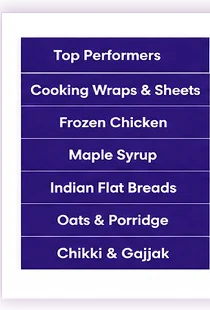
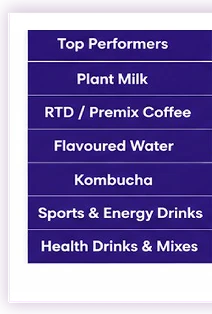
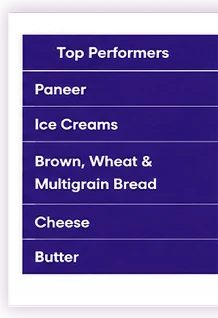
Across Staples, Snacks, Beverages and Bakery & VA Dairy, growth is increasingly concentrated in premium, health-focused and convenience-led segments such as Plant Milk, Kombucha, Cocoa Powder and Cooking Wraps.
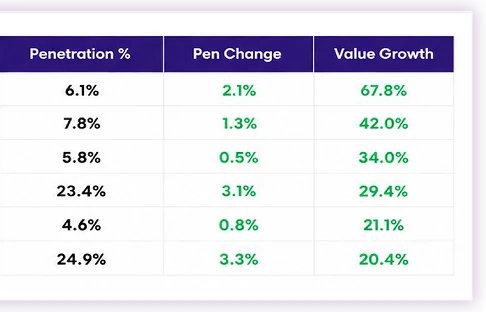
Top-Performing Segments Ranked By Value Growth : Q2 ‘25 vs Q2 ‘26
Top Performers in Staples, Q2’26
Top Performers in Snacks, Q2’26
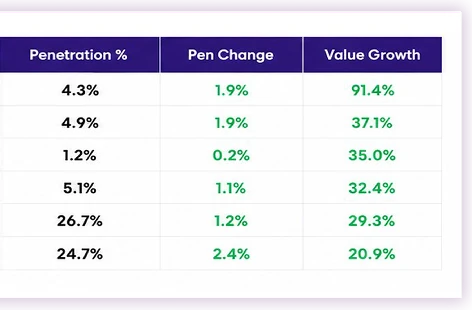
Top Performers in Beverages, Q2’26
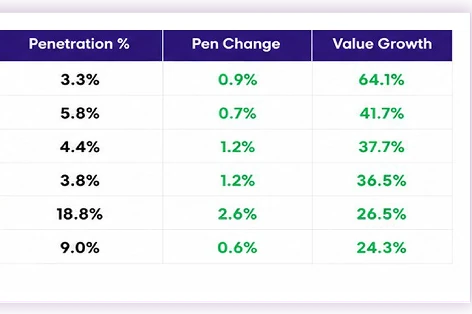
Top Performers in Bakery, Cakes and Dairy VA Q2’26
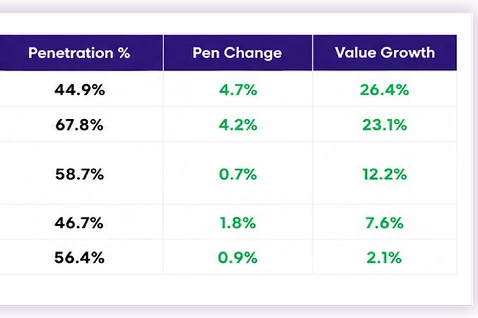
Data Source: Bintix | 6 Metros | Notes: Value Growth and Pen Change are in %
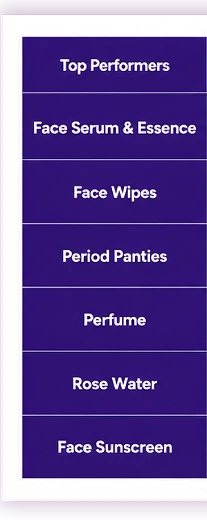
Innovation is also reshaping Personal Care and Home Care, with Face Serums, Laundry Pods and Dishwasher Tablets emerging as strong growth segments.
Top Performers in Personal Care, Q2’26
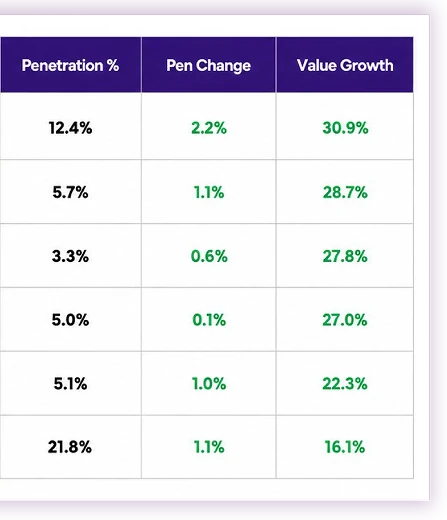
Top Performers in Home Care, Q2’26
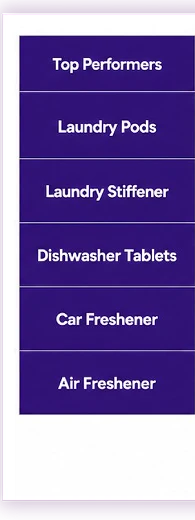
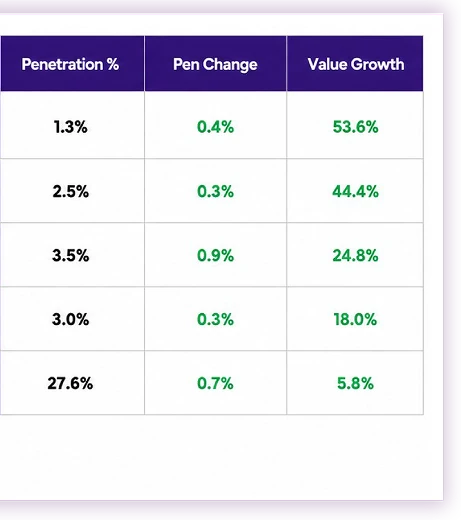
Data Source: Bintix | 6 Metros | Notes: Value Growth and Pen Change are in %

05
Pack and Price
Dynamics
Growth Is Being Sustained
Through More Packs
and Smaller Formats
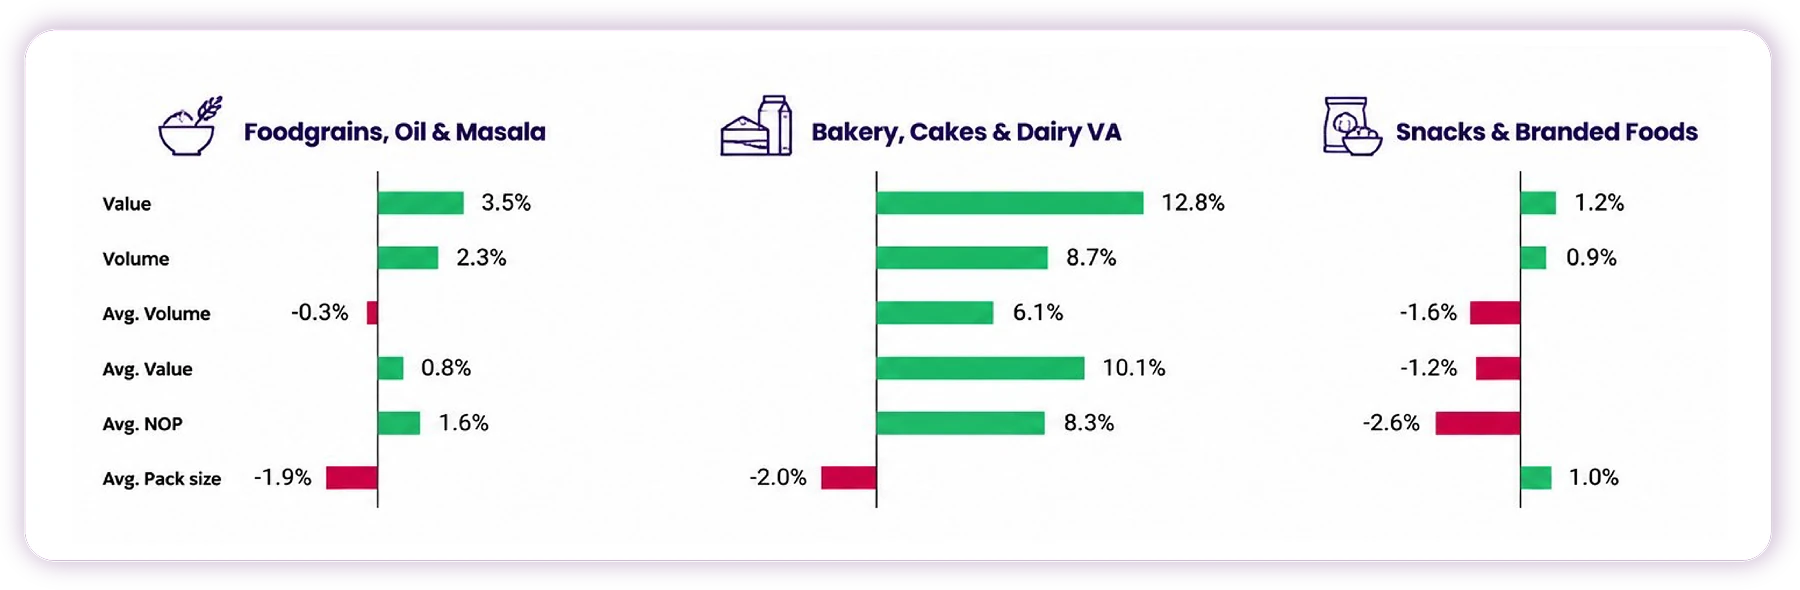
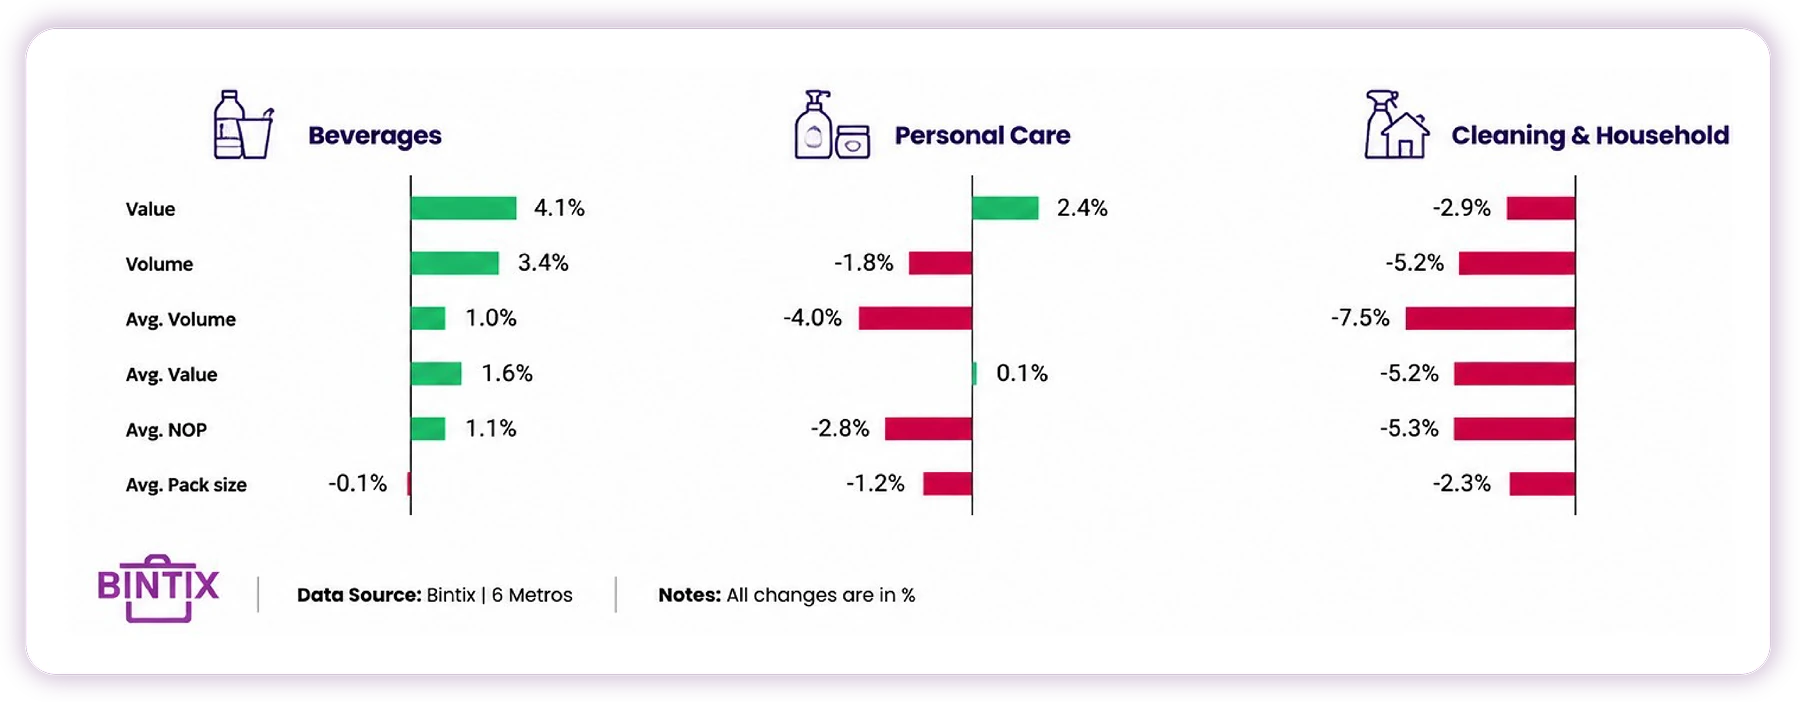
With household consumption remaining stable, FMCG growth is increasingly being supported by changes in consumption behaviour. More frequent purchases and smaller pack sizes are helping sustain FMCG growth, particularly across Bakery & VA Dairy and Staples.
Pack, Price & Purchase Dynamics Across Key Super Categories : Q2'26 vs Q2'25

06
Metro Story
Dynamics
FMCG Growth Is Becoming
Increasingly Localised
Value And Volume Growth (%) of FMCG - Q2'25 vs Q2'26
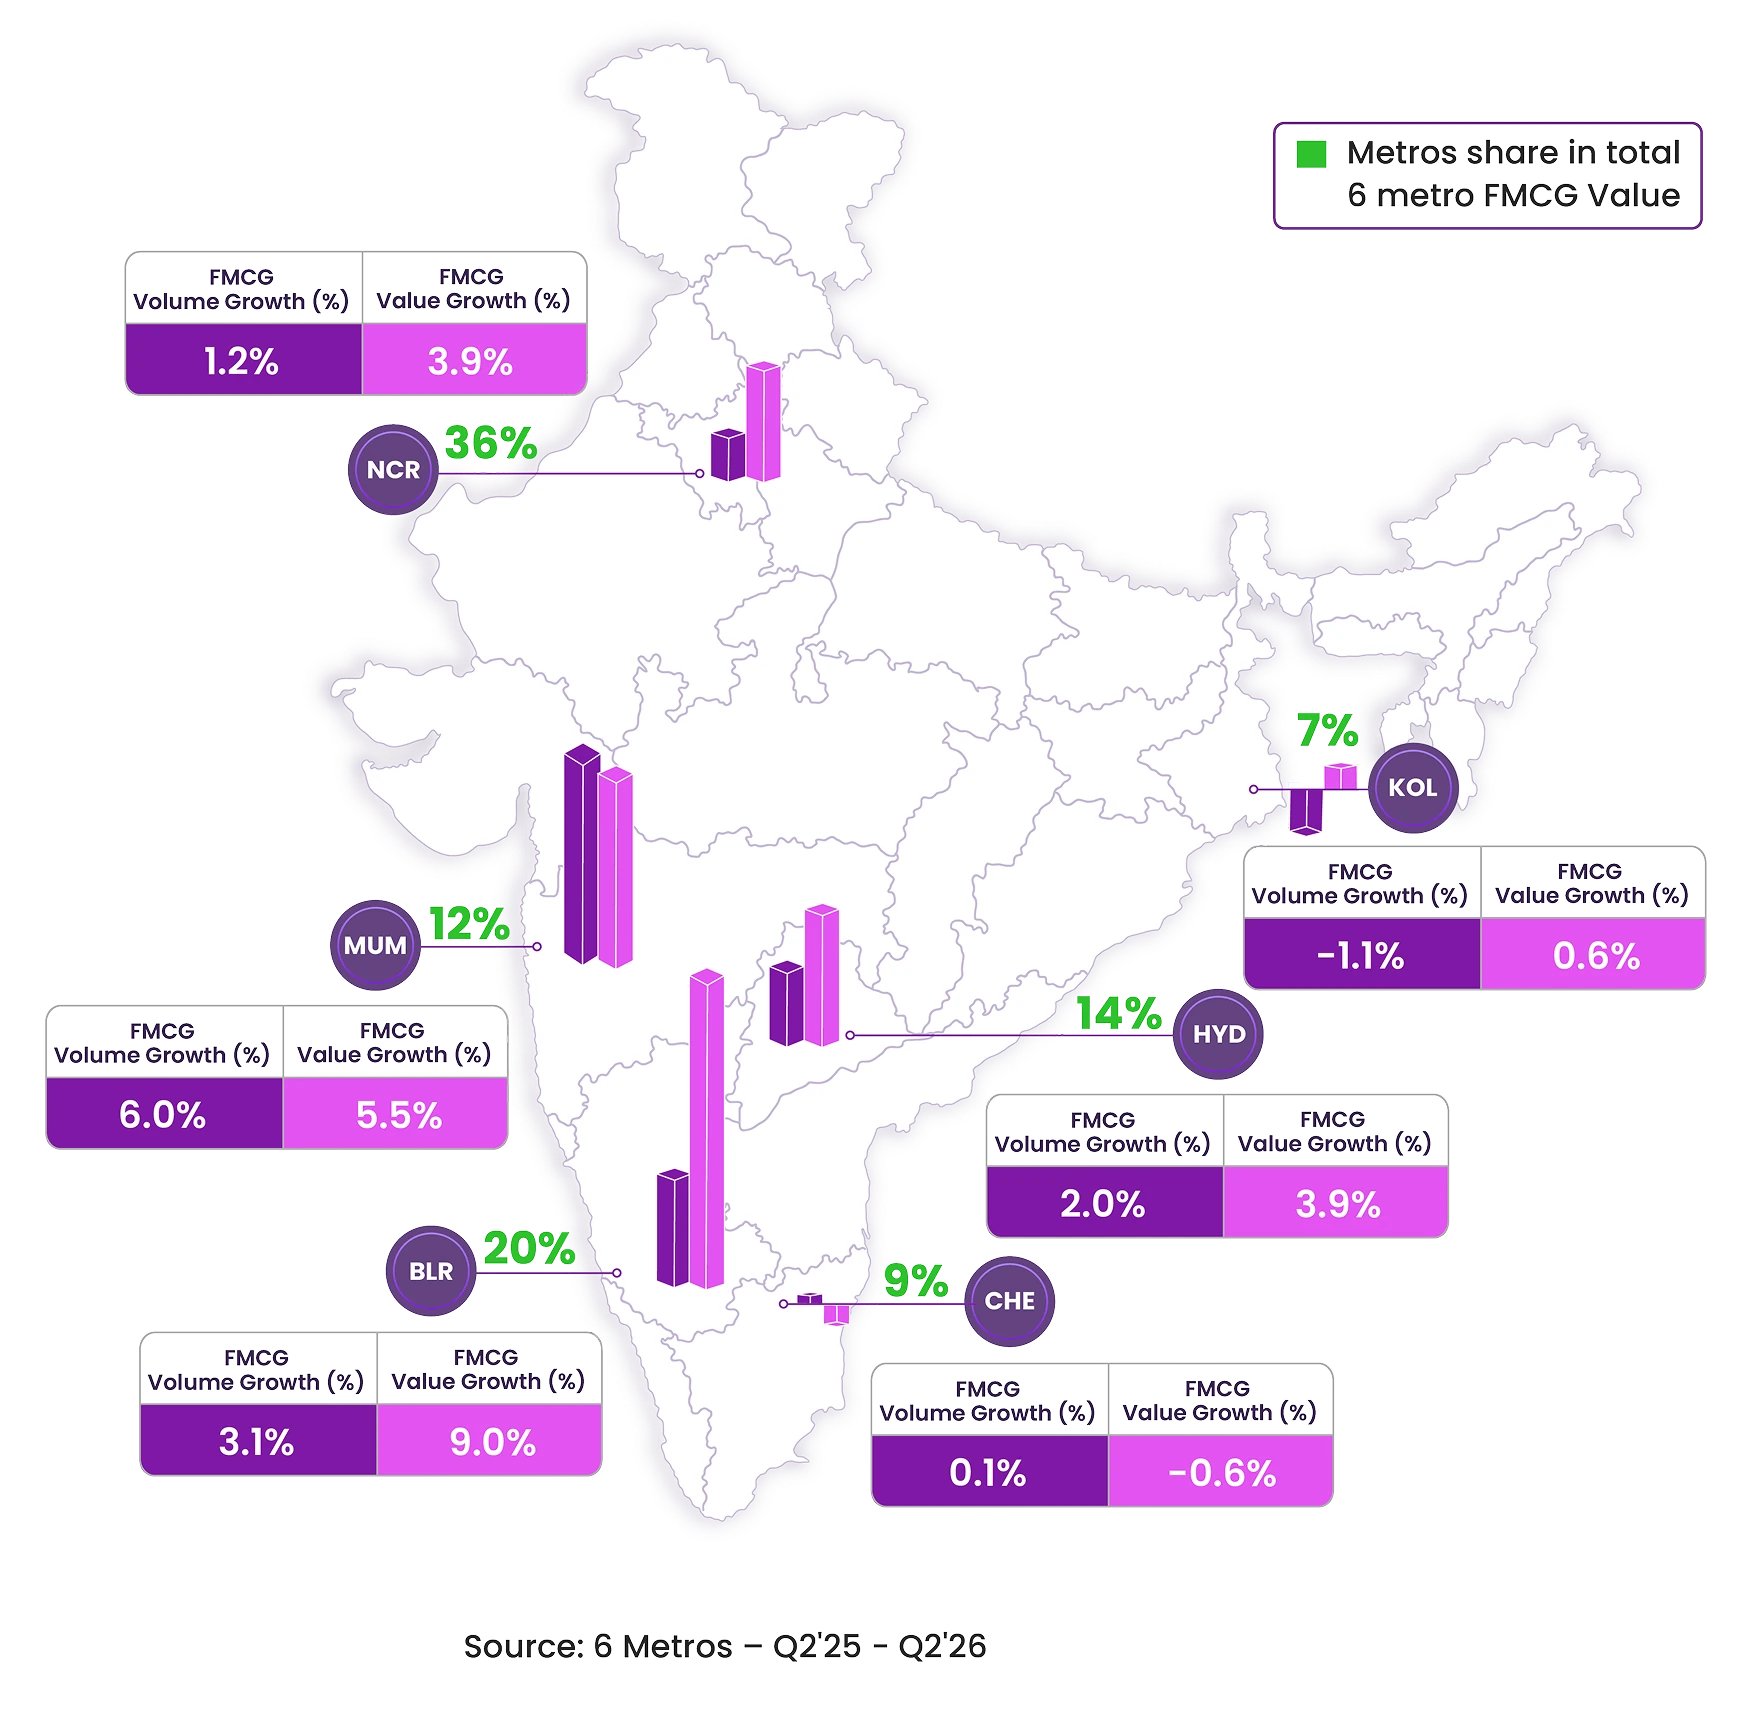
While overall FMCG growth remains resilient, performance is becoming increasingly differentiated across India's metros. Local category preferences and spending patterns are creating distinct growth trajectories, making city-level execution more important than ever.
Bengaluru leads value growth while Mumbai drives volume growth, highlighting increasingly divergent FMCG performance across India's metros.
City-wise Growth in Value (%) : Q2 ‘25 vs Q2 ‘26
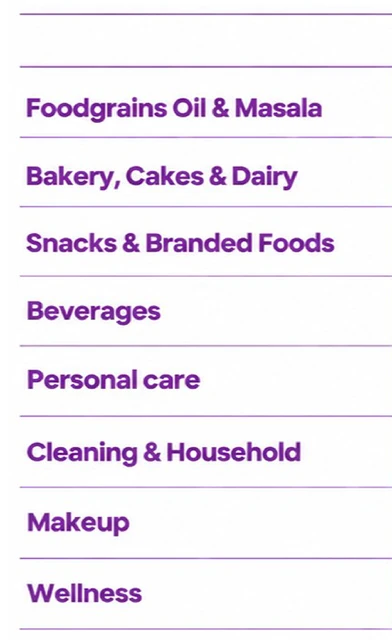
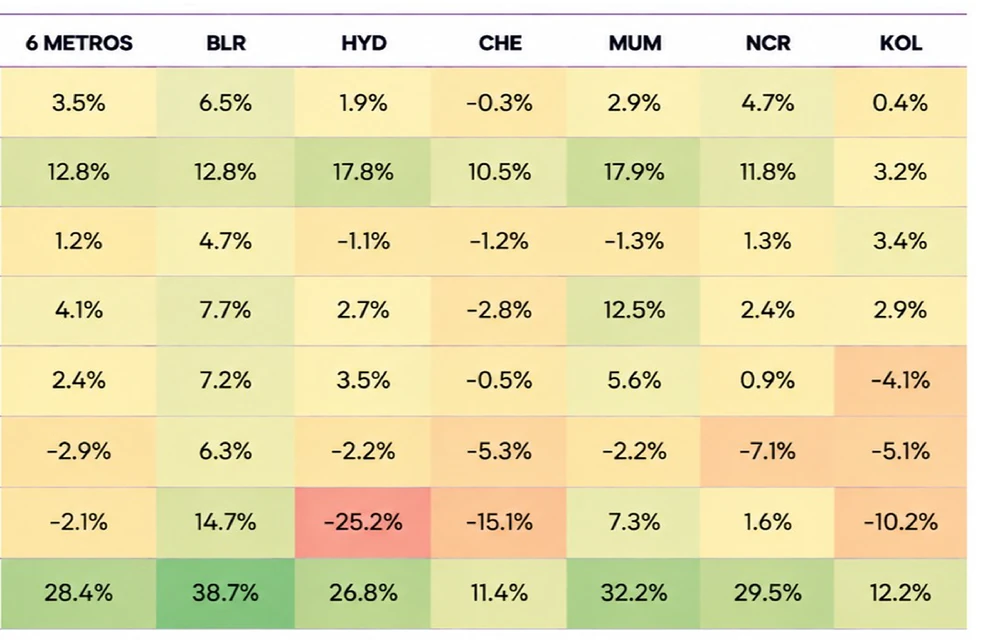
Data Source: Bintix | 6 Metros | Note: Heatmap is applied to the full value range.
Wellness and Bakery & VA Dairy are the most consistent growth engines across metros. Beyond these, growth becomes more city-specific: Bengaluru records broad-based gains, Mumbai is led by Beverages, Hyderabad by Bakery & VA Dairy, Kolkata by Snacks, and NCR by Staples.

07
Q2’26 Summer
Categories Outpaced
Last Year
Summer Demand Strengthened
Across More Categories
Compared with Q2 '25, summer conditions gave FMCG an additional lift in Q2 '26, with refreshment, hydration, cooling dairy and seasonal personal care recording stronger momentum. However, the intensity and drivers of seasonal growth varied significantly across categories and metros.
Summer-sensitive categories such as Ice Creams, Soft Drinks, Sports & Energy Drinks and Yoghurt recorded their strongest volumes during the current summer quarter, highlighting the seasonal uplift in refreshment-led consumption.
Quarterly volume trends across selected seasonal categories | Q1’23–Q2’26
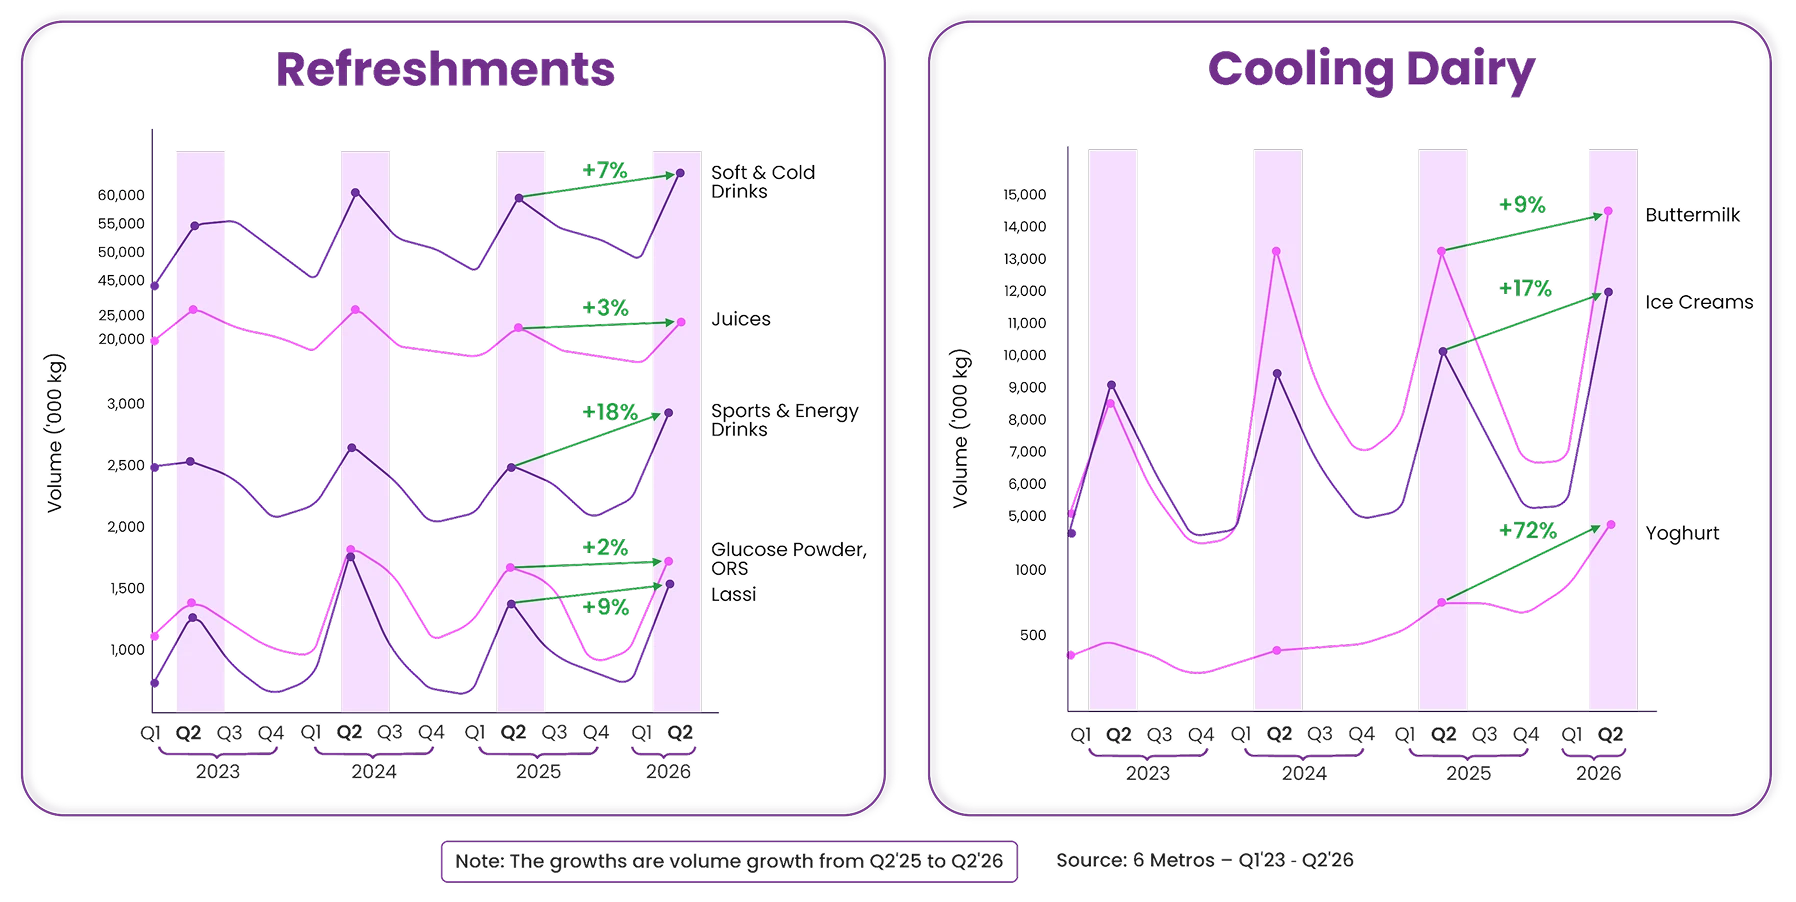
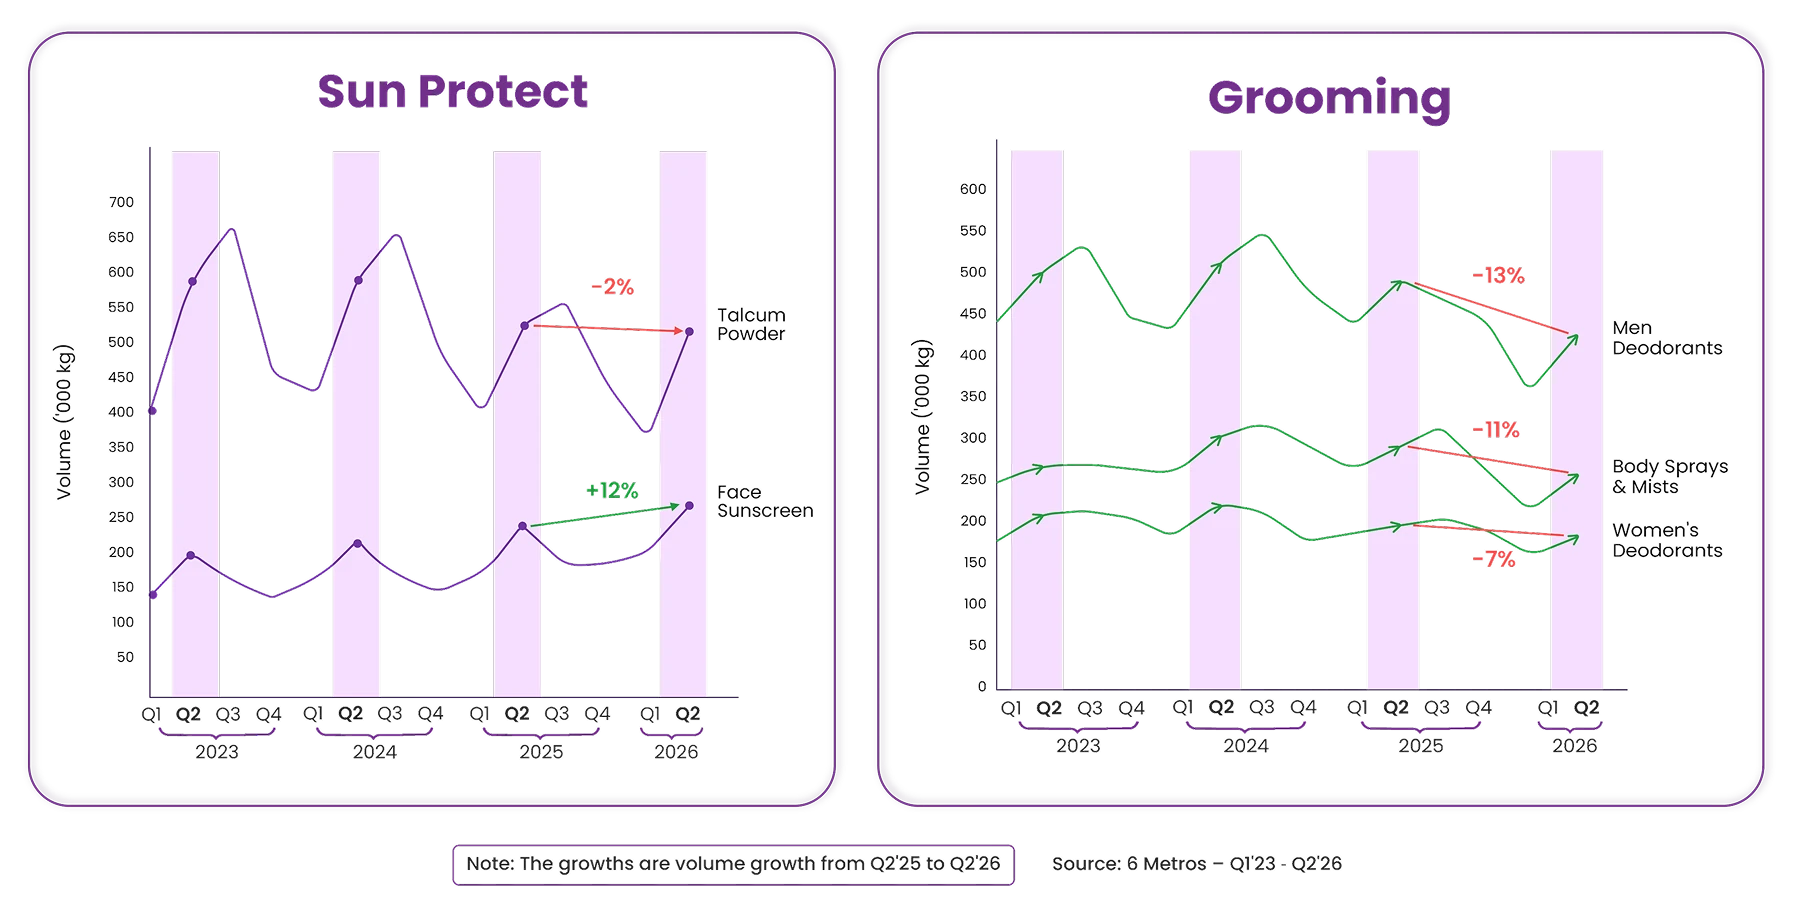
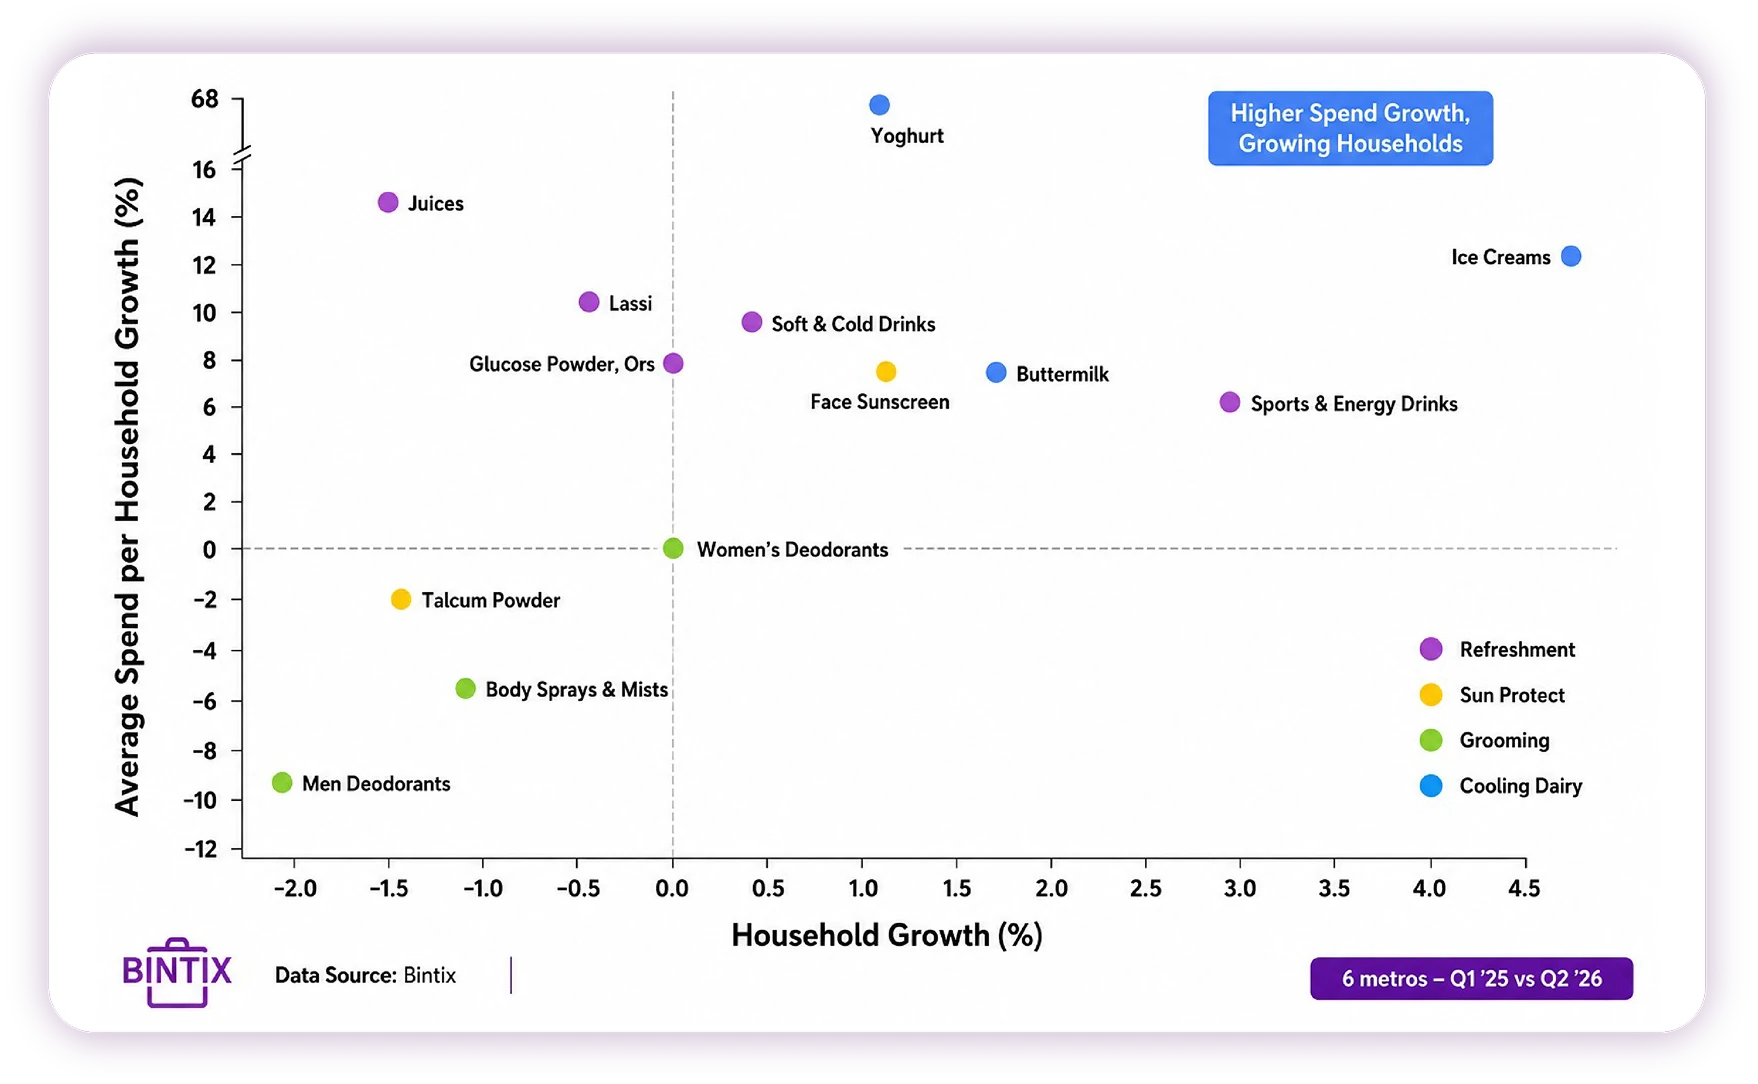
Summer categories are growing through two distinct engines—Ice Creams and Sports & Energy Drinks are expanding by recruiting more households, while Yoghurt stands apart as the only category combining strong household recruitment with higher spend per buyer.
Household Growth vs Average Spend Growth : Q2 ‘25 vs Q2 ‘26
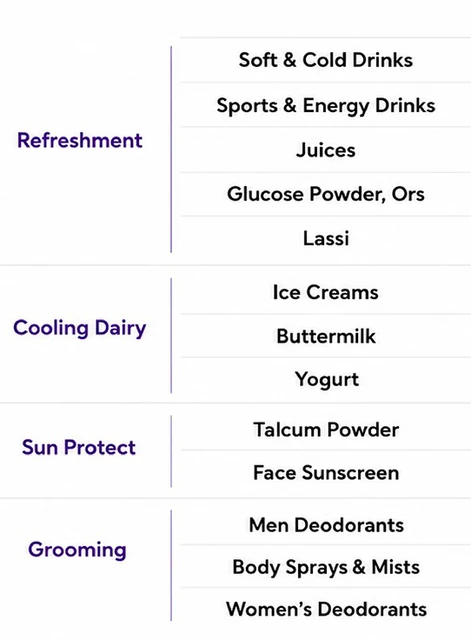
Summer demand is highly localised, with Hyderabad leading the Refreshment and Cooling Dairy clusters, Mumbai outperforming in indulgence-led summer categories, and Kolkata recording the weakest seasonal response across most Refreshment and Grooming categories.
Volume Growth (%) : Q2 ‘25 vs Q2 ‘26
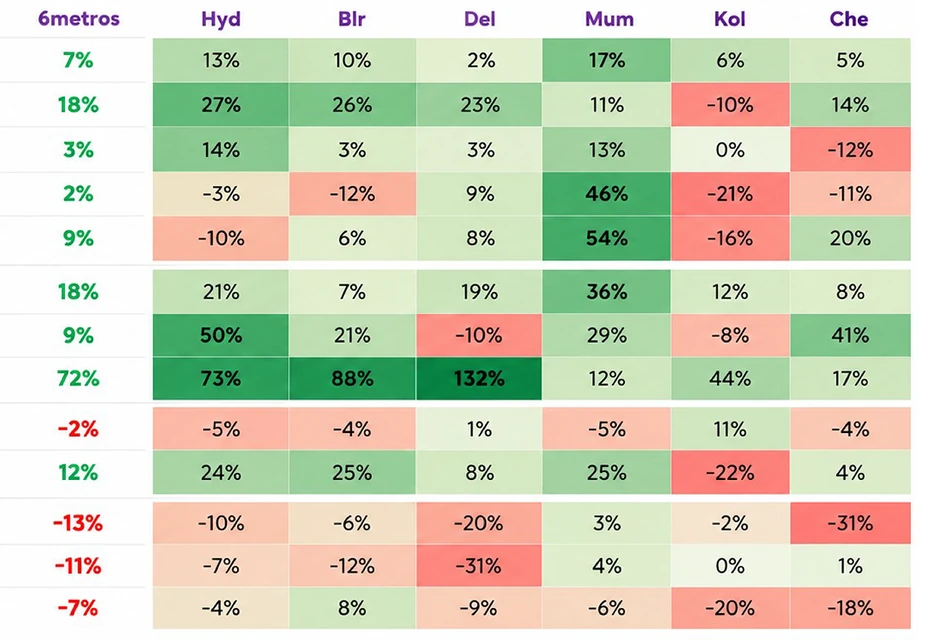
Data Source: Bintix | 6 metros – Q1 ’25 vs Q2 ’26
Conclusion
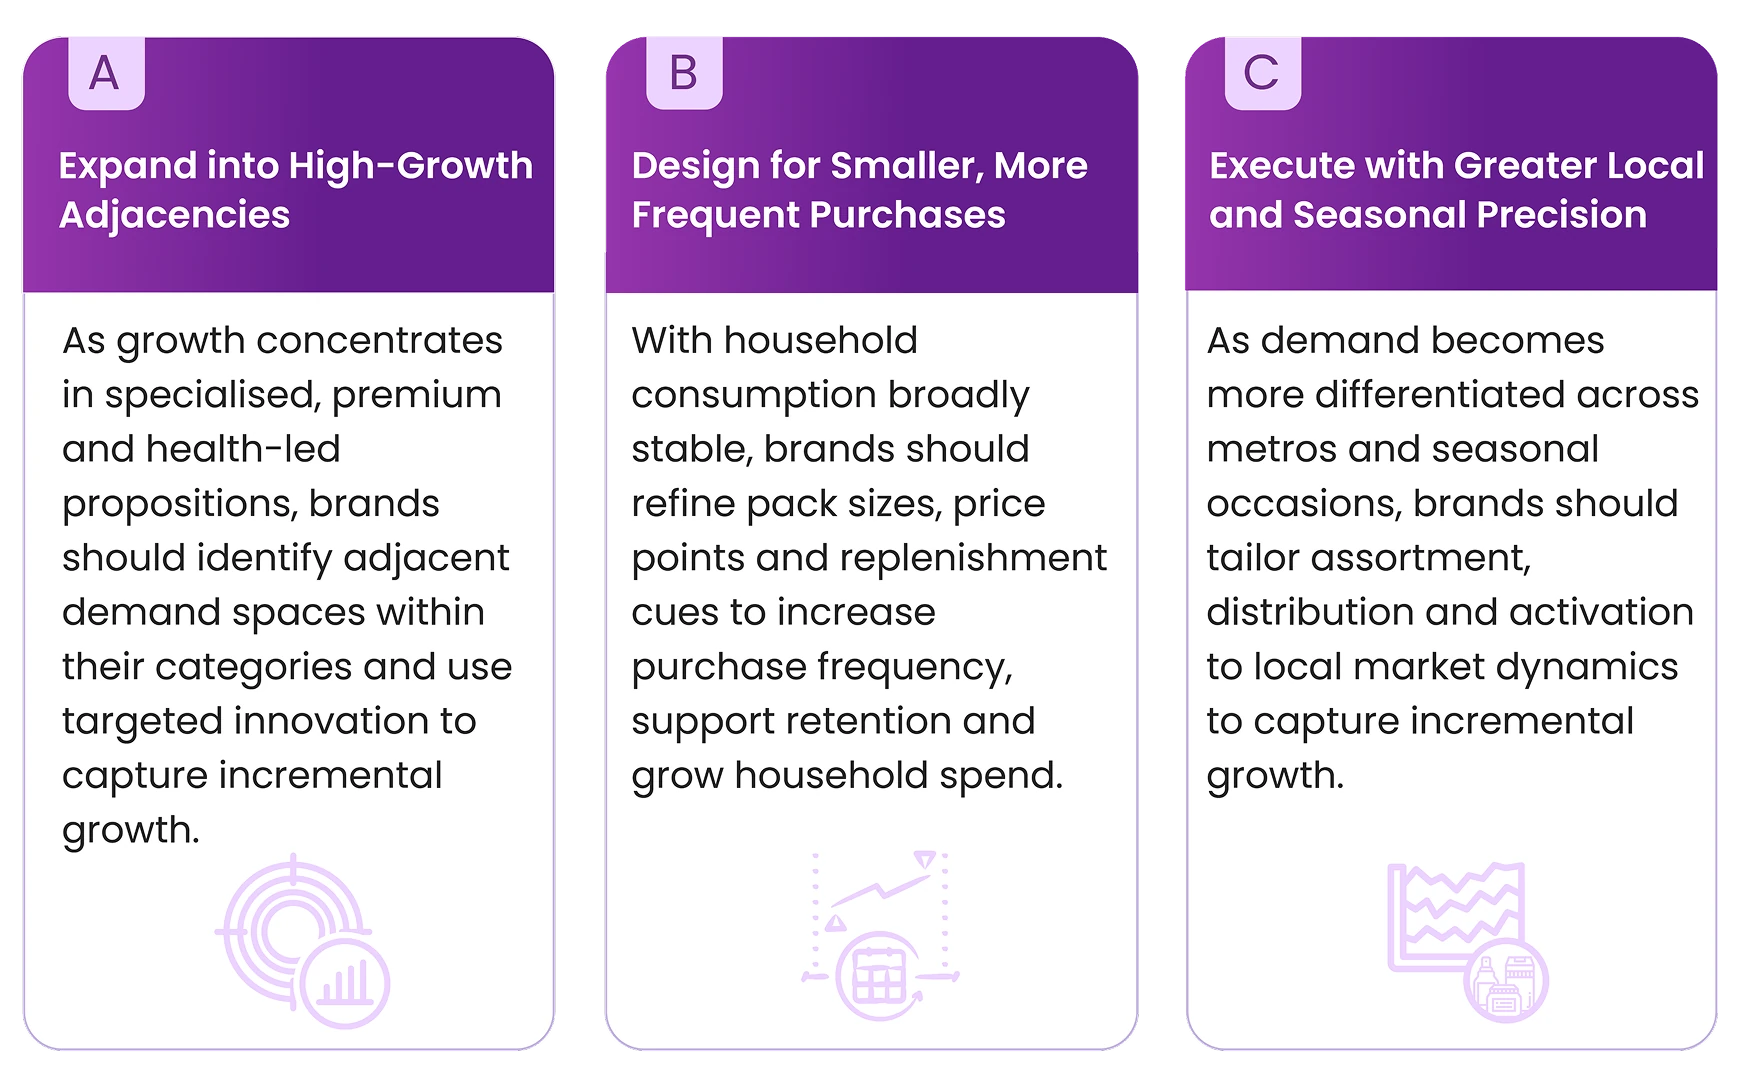
Suggested use of Q2 learnings for Brands
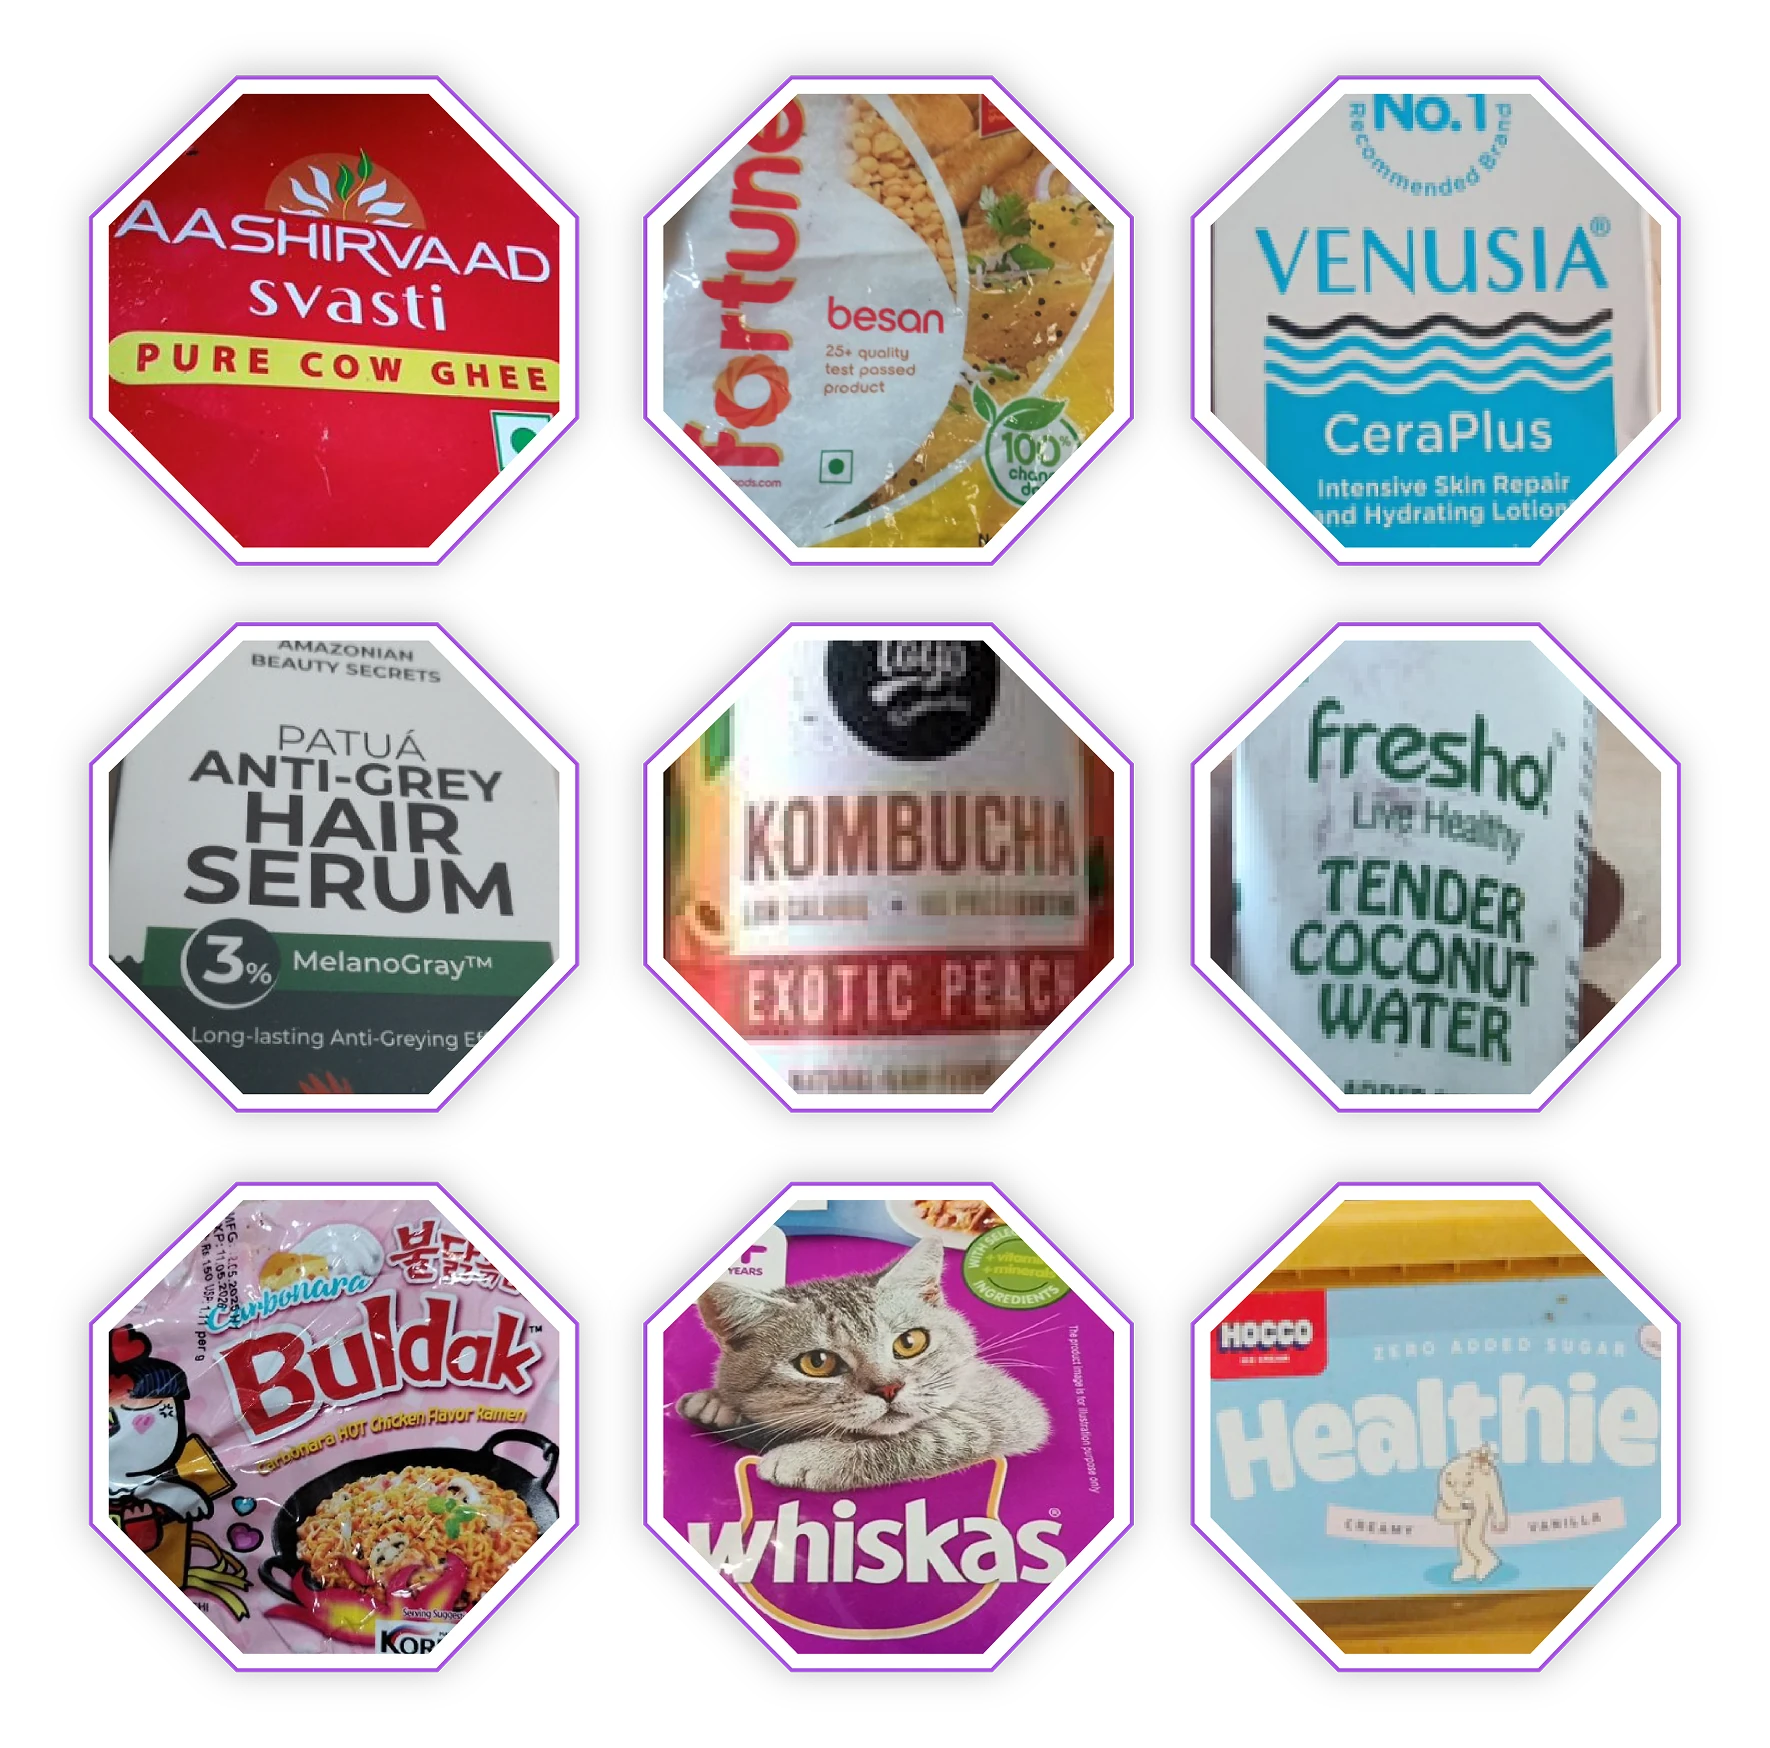
Real Packs.
Real Data.
4 Million SKUs
Scanned Daily With AI At Bintix
Exclusive India - A
Home Panel

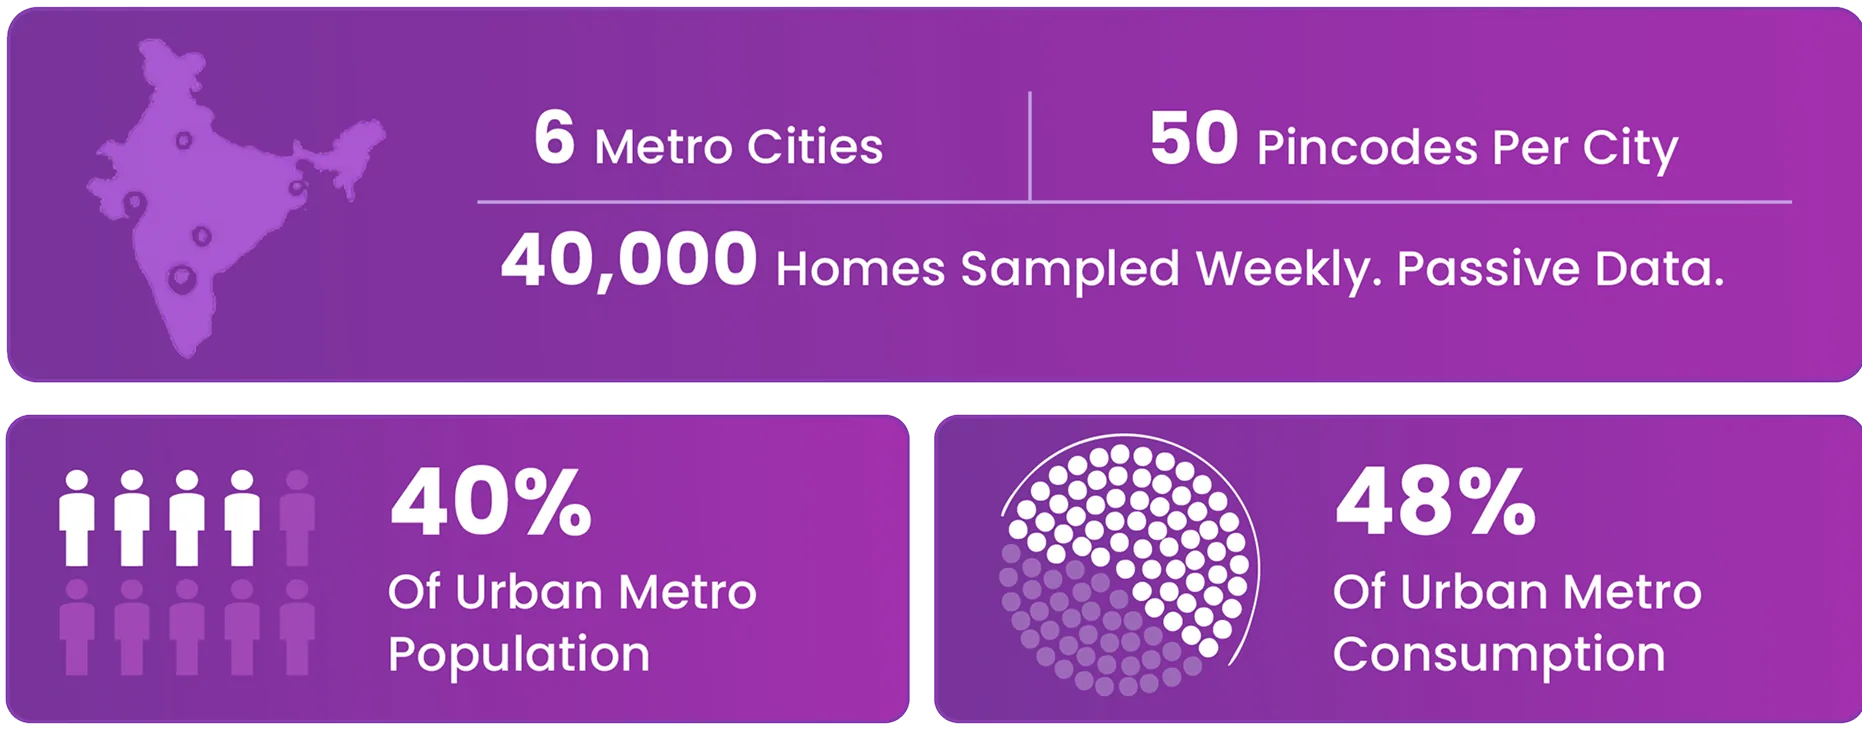
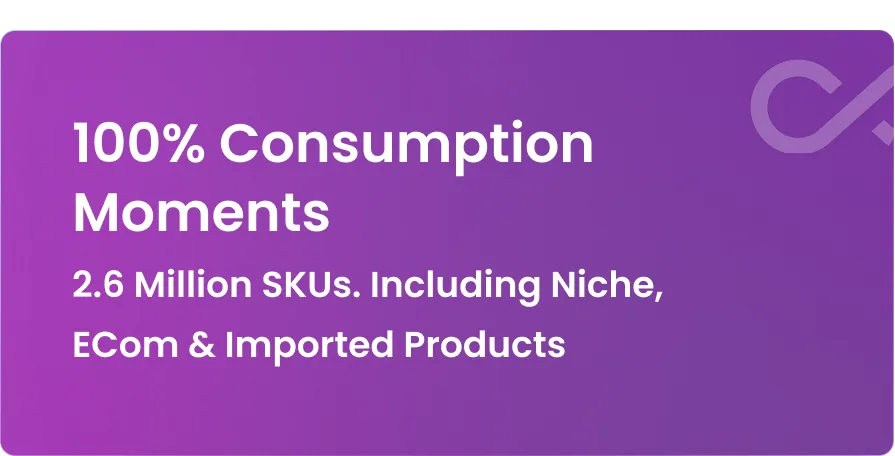
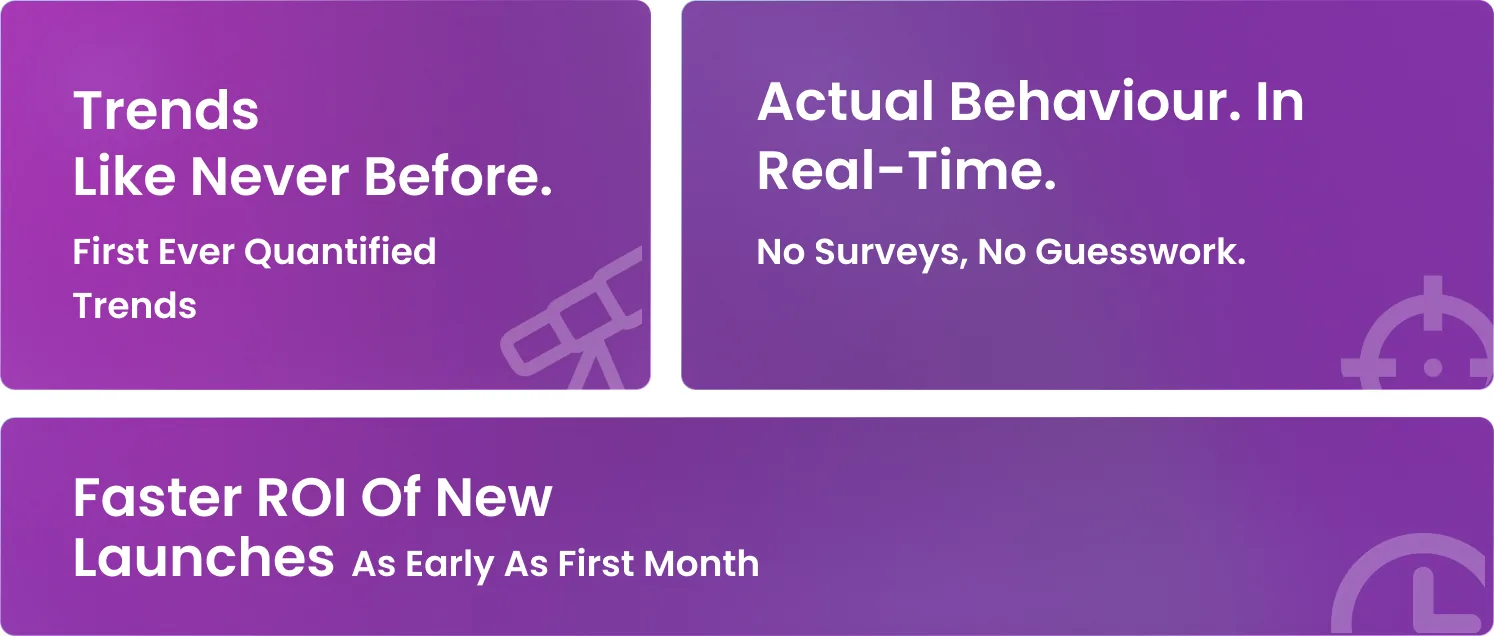
Unmatched Consumer Intelligence
* Representing Bintix Universe of NCCS A1A2 (National Consumer Classification System)
Some Human Images in this page have been generated using artificial intelligence
Subscribe To Unlock Exclusive Insights
Similar Reports
Tradition & Convenience Are Coming Together
India's Breakfast Revolution
The Fast Changing Food Landscape
In India’s Affluent Homes
Four Big Shifts In The Glamour Game
Colour Cosmetics In India A