
Body Lotions Are Narrowing The Seasonal Gap In India-A
Category
PERSONAL CARE / BODY CARE / BODY LOTIONS & CREAMS
Context
Understanding how household consumption of Body Lotions & Creams is changing across seasons, pack sizes, cities and brands.
Year
MAT March 2026
Key Insight
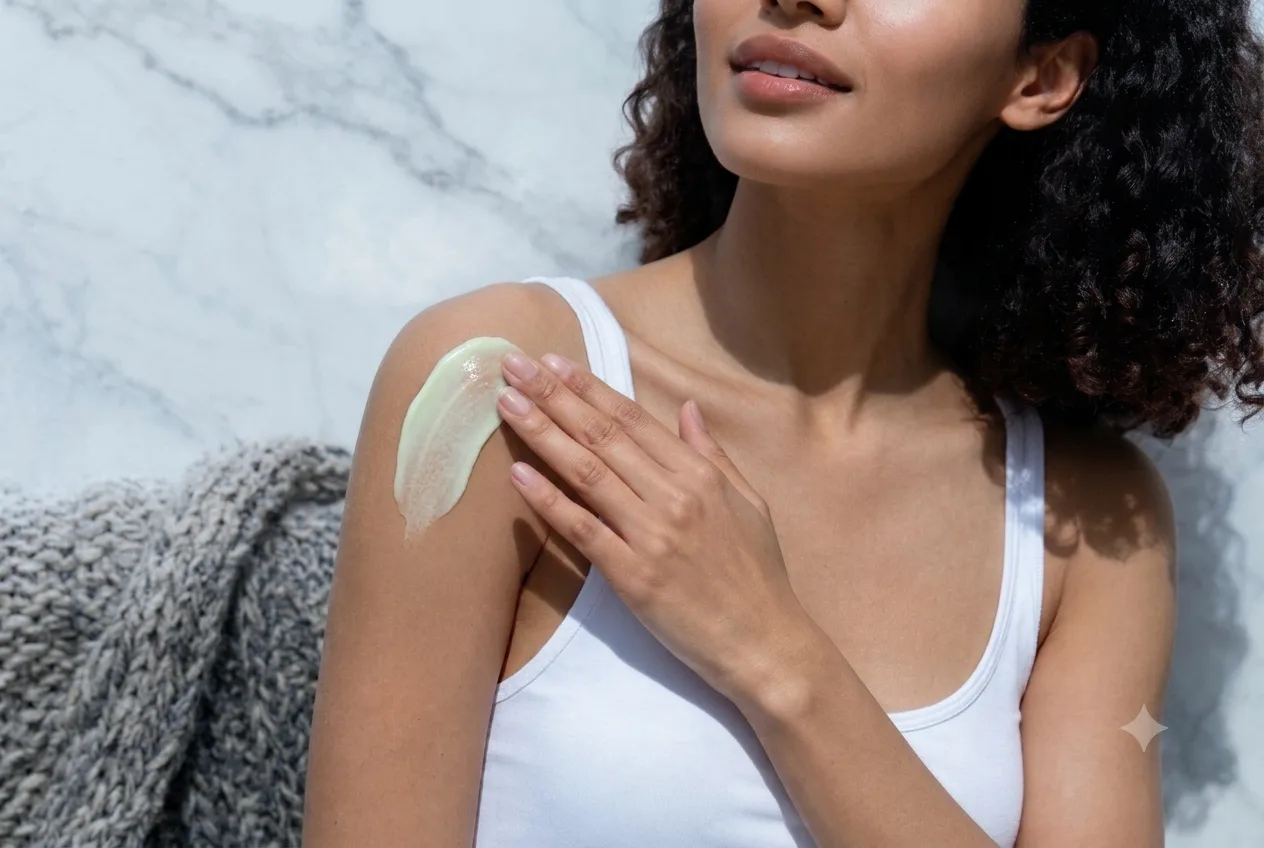
Body Lotions & Creams is reaching more households, while the gap between summer and winter is narrowing. This points to a change in how households consume the category across seasons.
More Households Are Consuming Body Lotions & Creams
Body Lotions & Creams have long been associated with winter moisturising. But their role in household skincare routines is evolving, with consumption extending beyond the colder months.
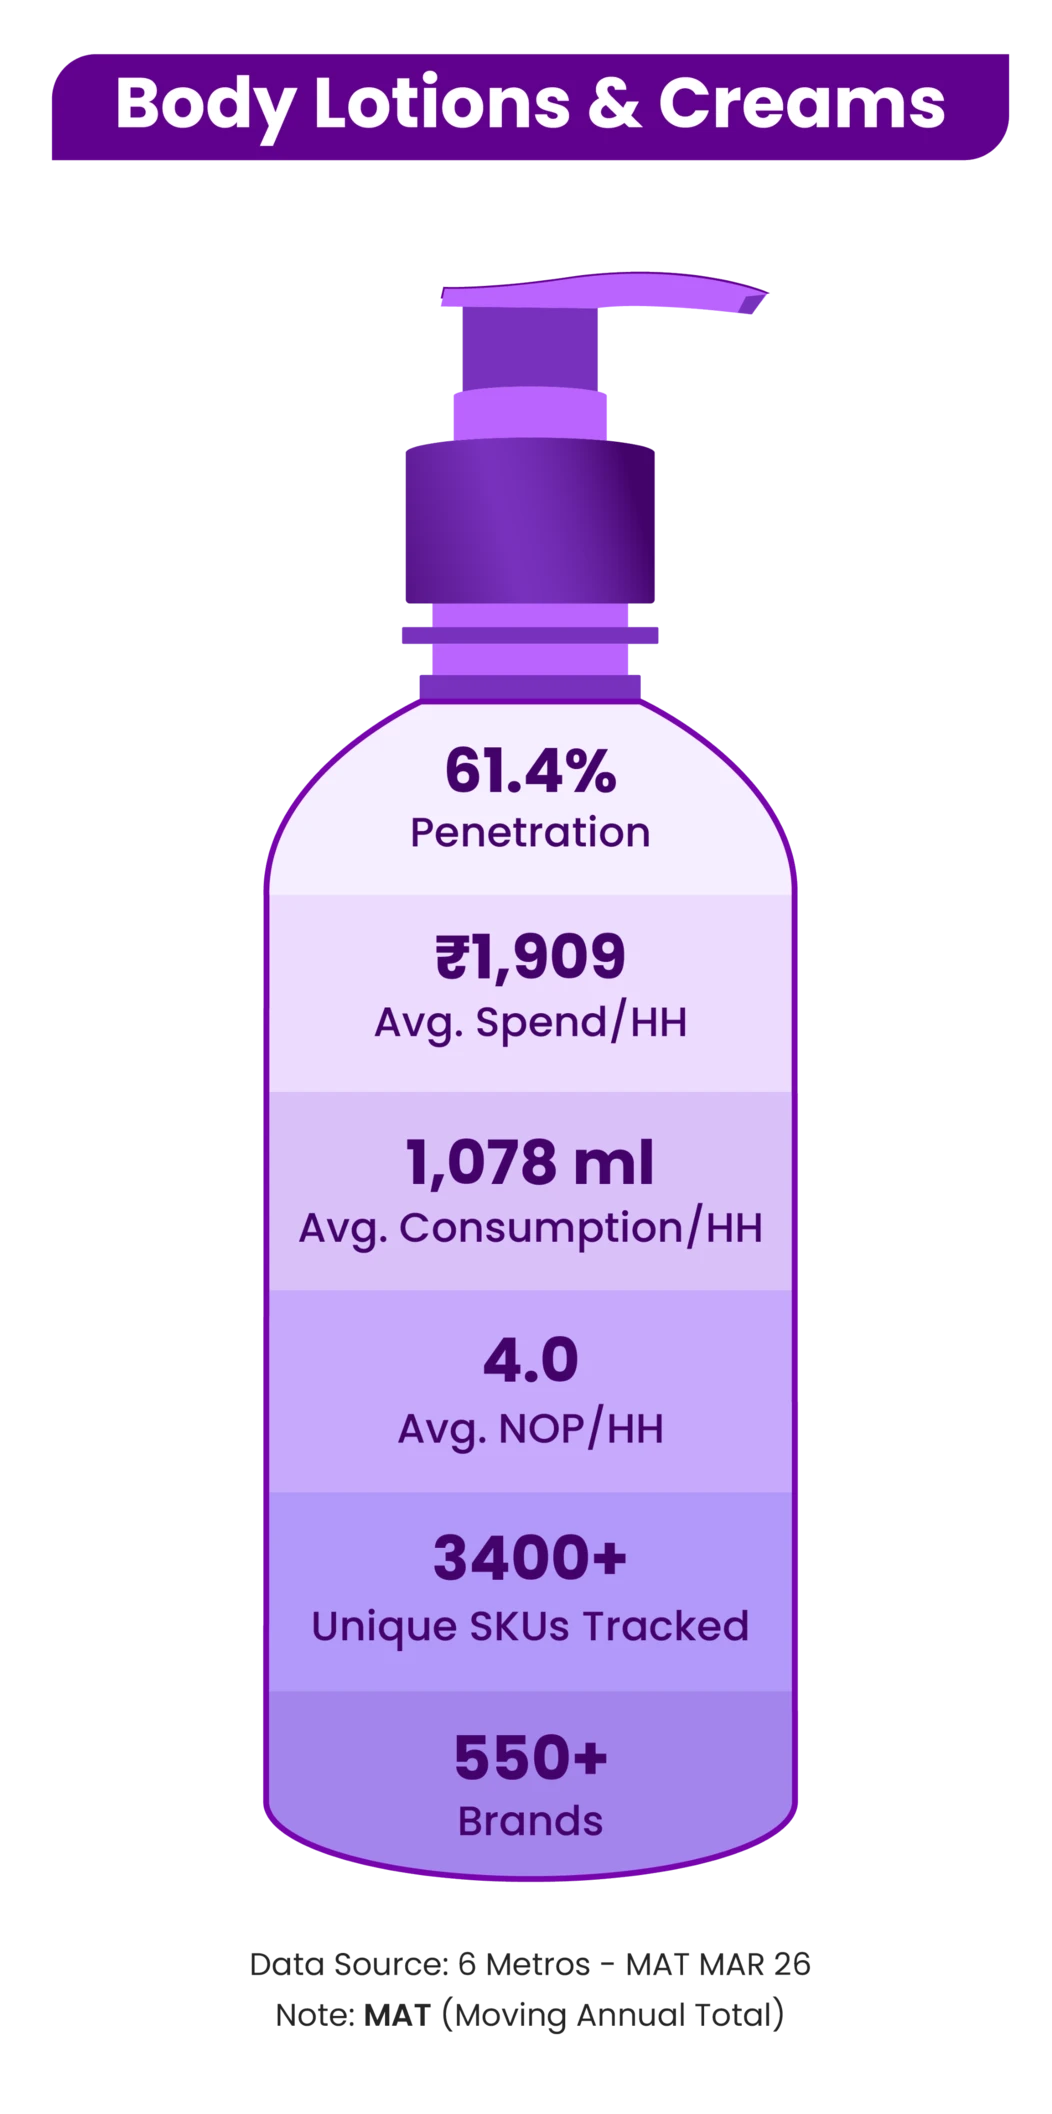
The category now reaches 61.4% of India-A households across six metros. On average, consuming households spend around ₹1,900 a year and consume close to 4 packs annually. Household Reach increased by 245 bps in March ’26.
New Households Are Driving Category Growth
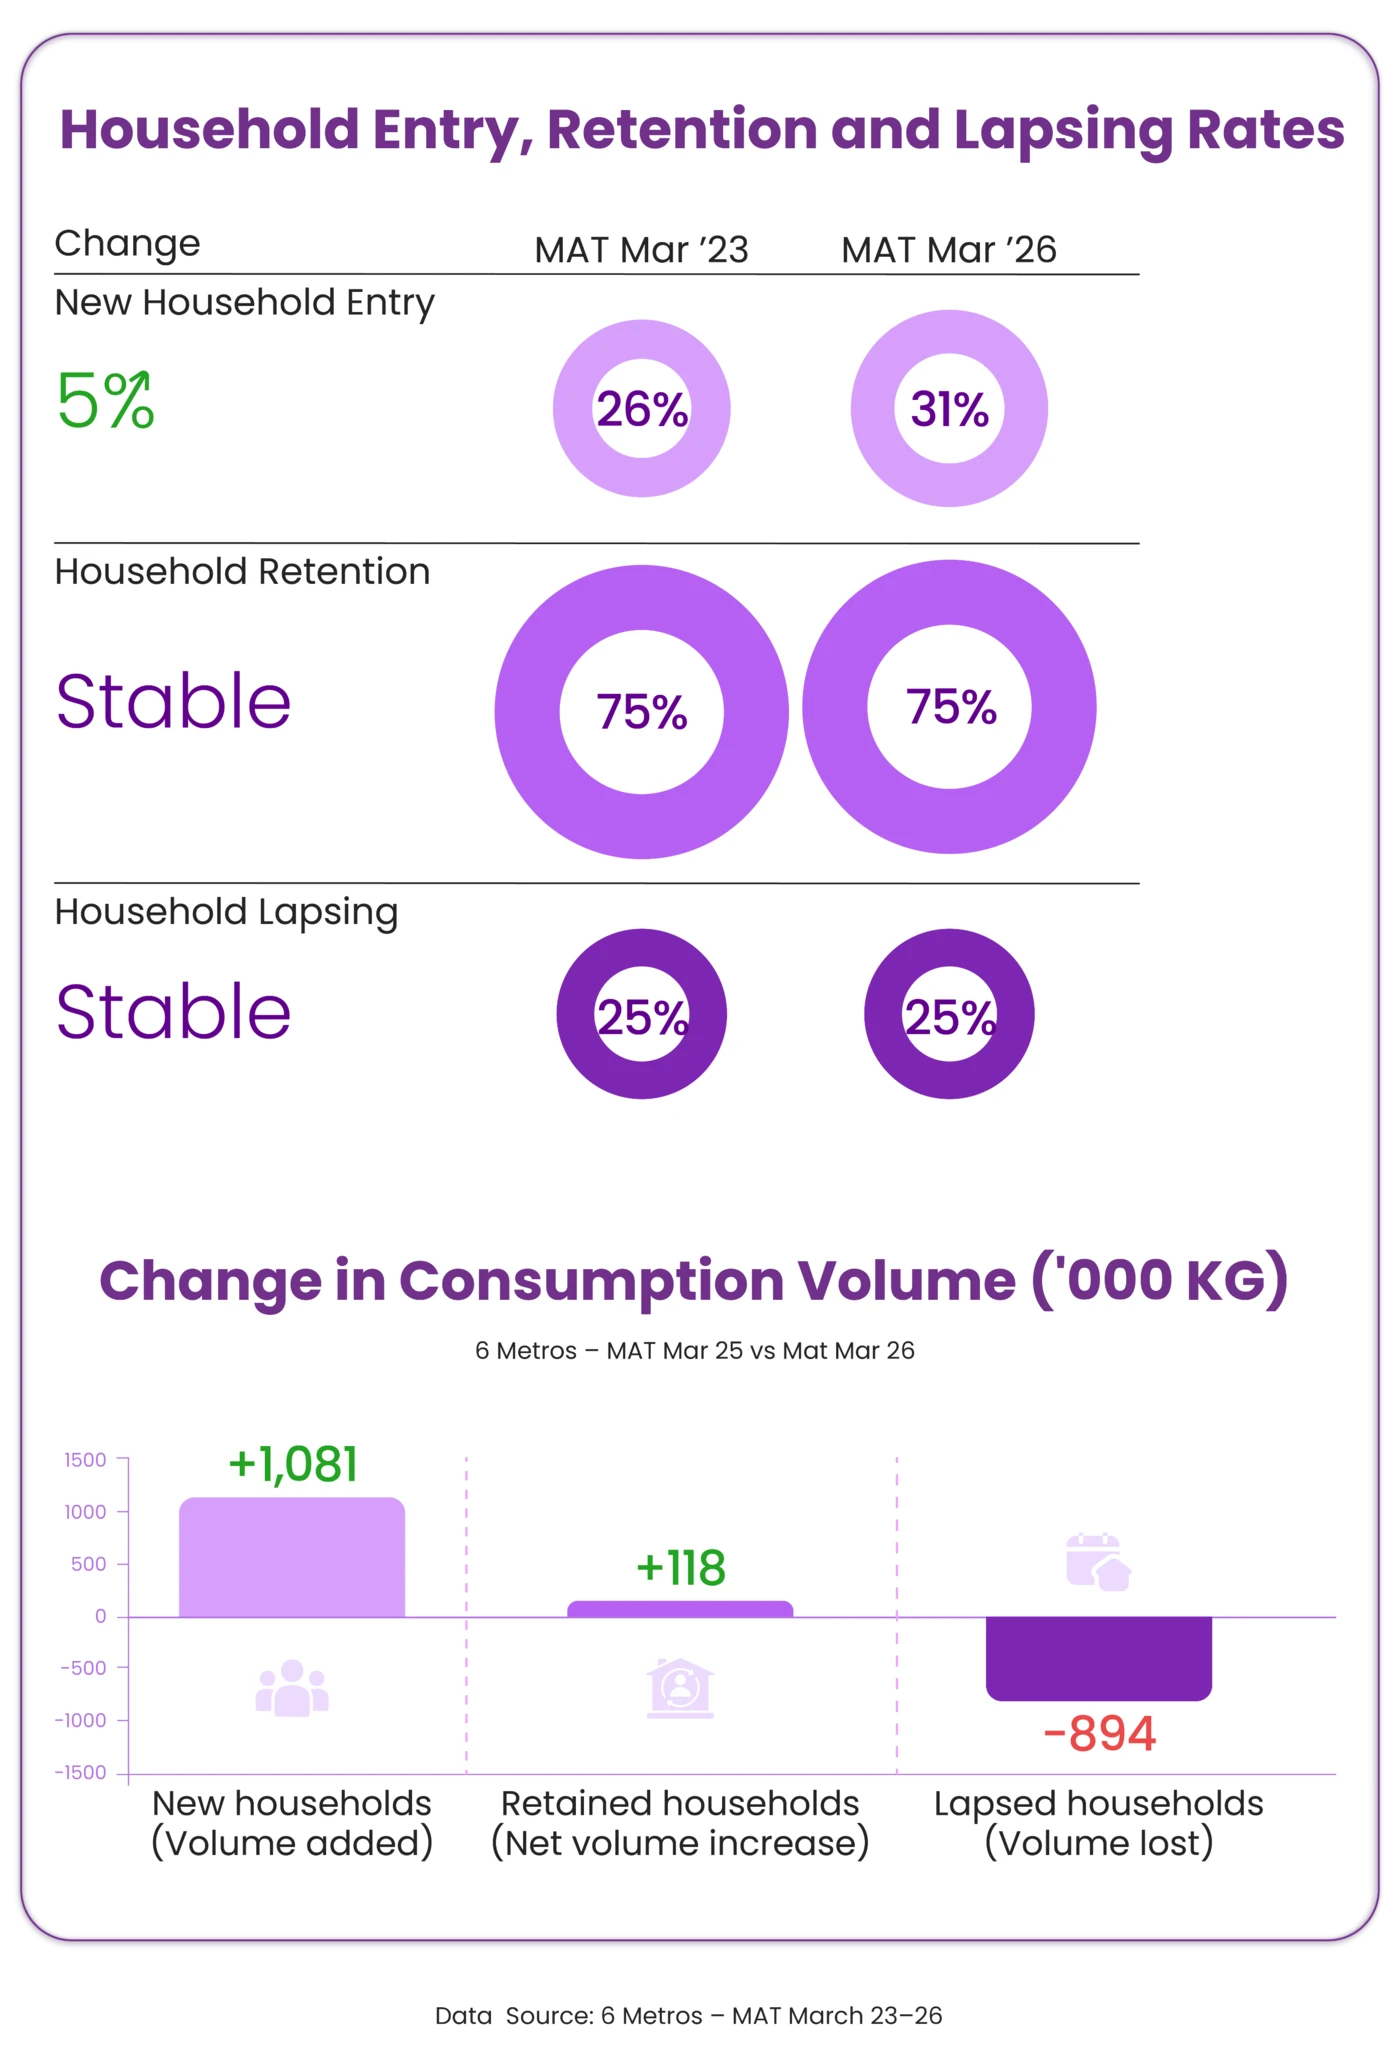
As Body Lotions & Creams reaches more households, new household entry is playing a bigger role in its growth. Retention has remained steady at around 75%, while the volume added by new households continues to outweigh the volume lost from those leaving the category.
The Gap Between Summer And Winter Is Narrowing
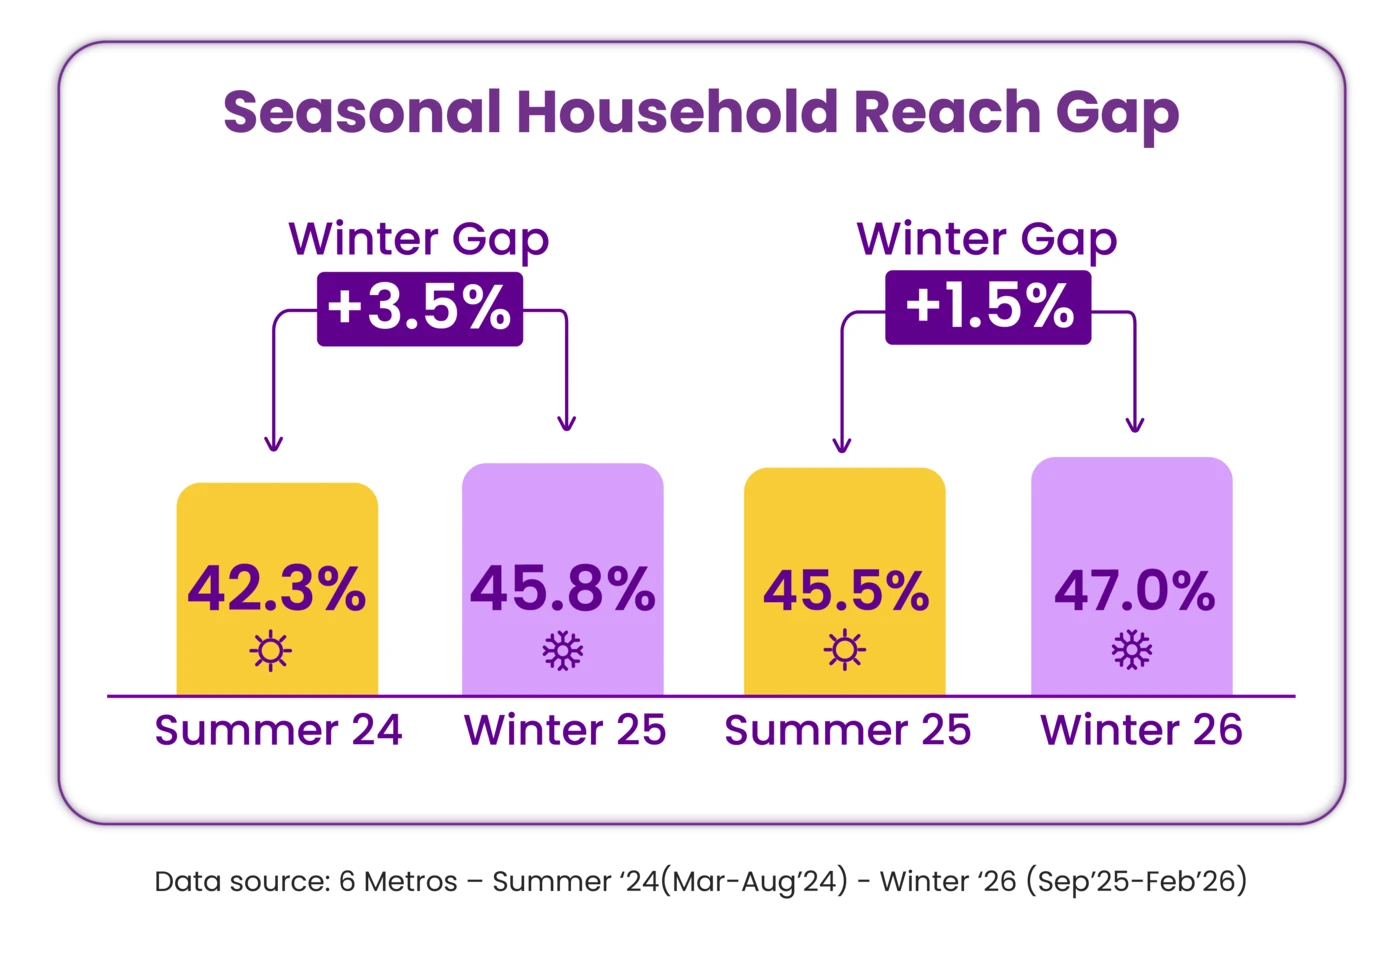
Winter continues to see more households consuming Body Lotions & Creams than summer, but the difference is getting smaller. The gap in Household Reach has narrowed from 350 bps to 150 bps, while summer Household Reach has increased from 42% to 46%.
Seasonal Patterns Differ Across Metros
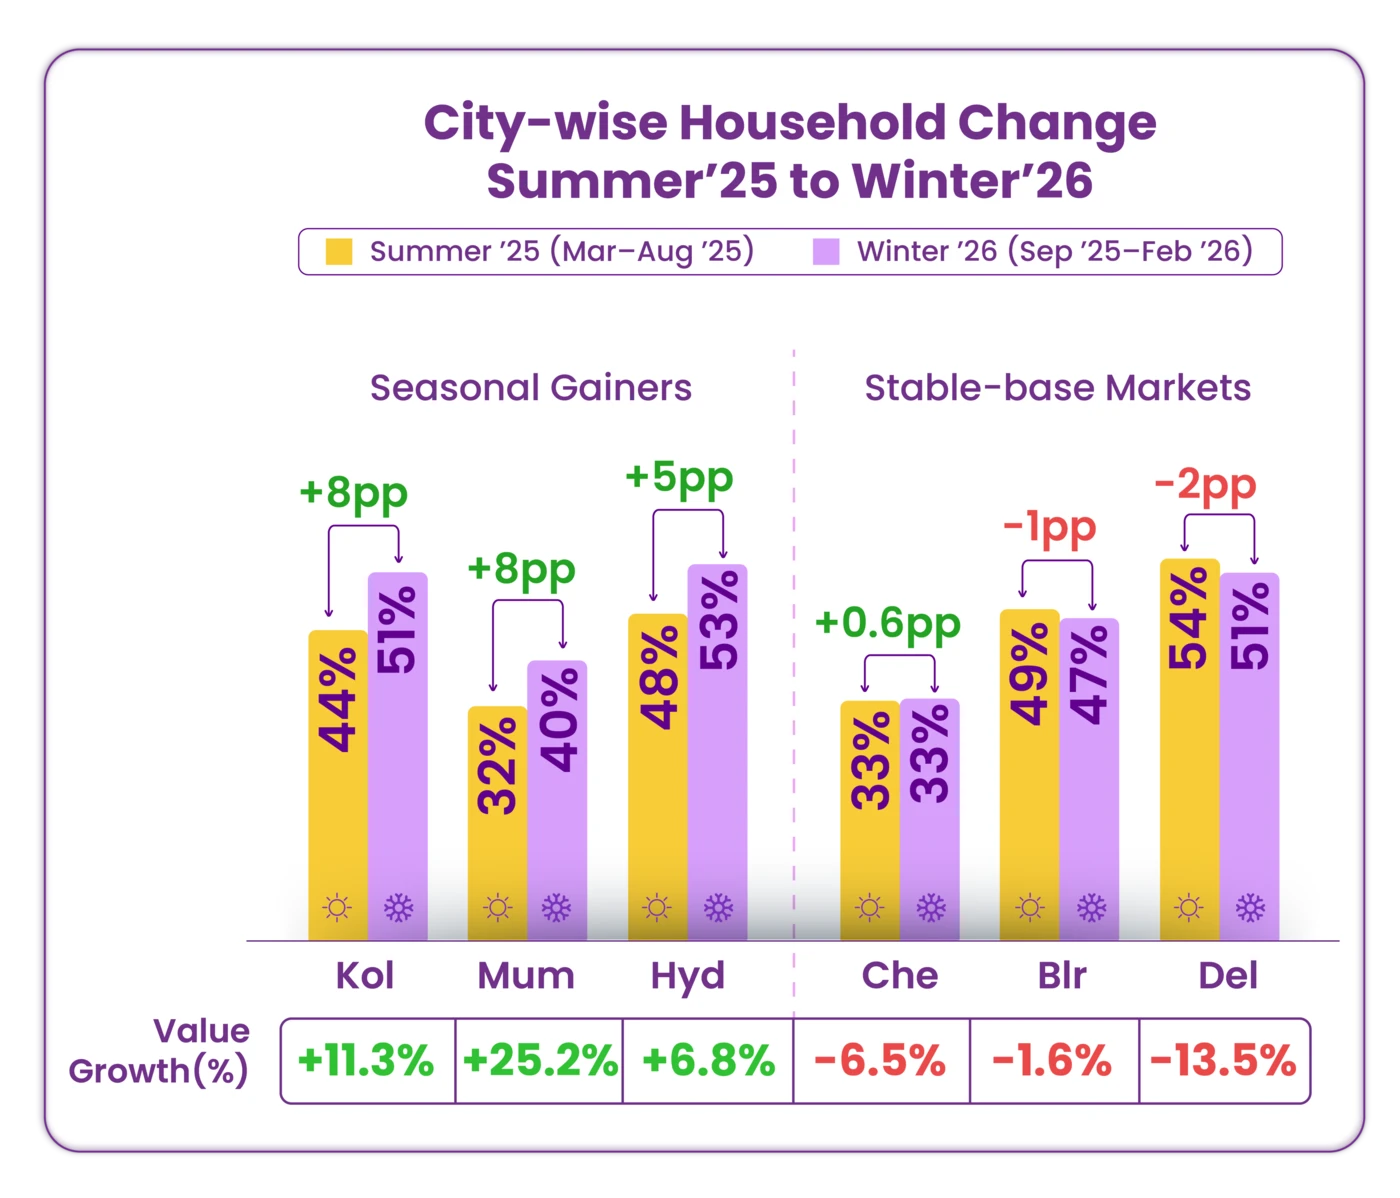
The difference between summer and winter varies across cities. Kolkata, Mumbai and Hyderabad see more households consuming Body Lotions & Creams during winter, along with an increase in category value. In Delhi, Bengaluru and Chennai, Household Reach changes very little between seasons, while category value declines in winter.
New Household Gains Differ Across Brands
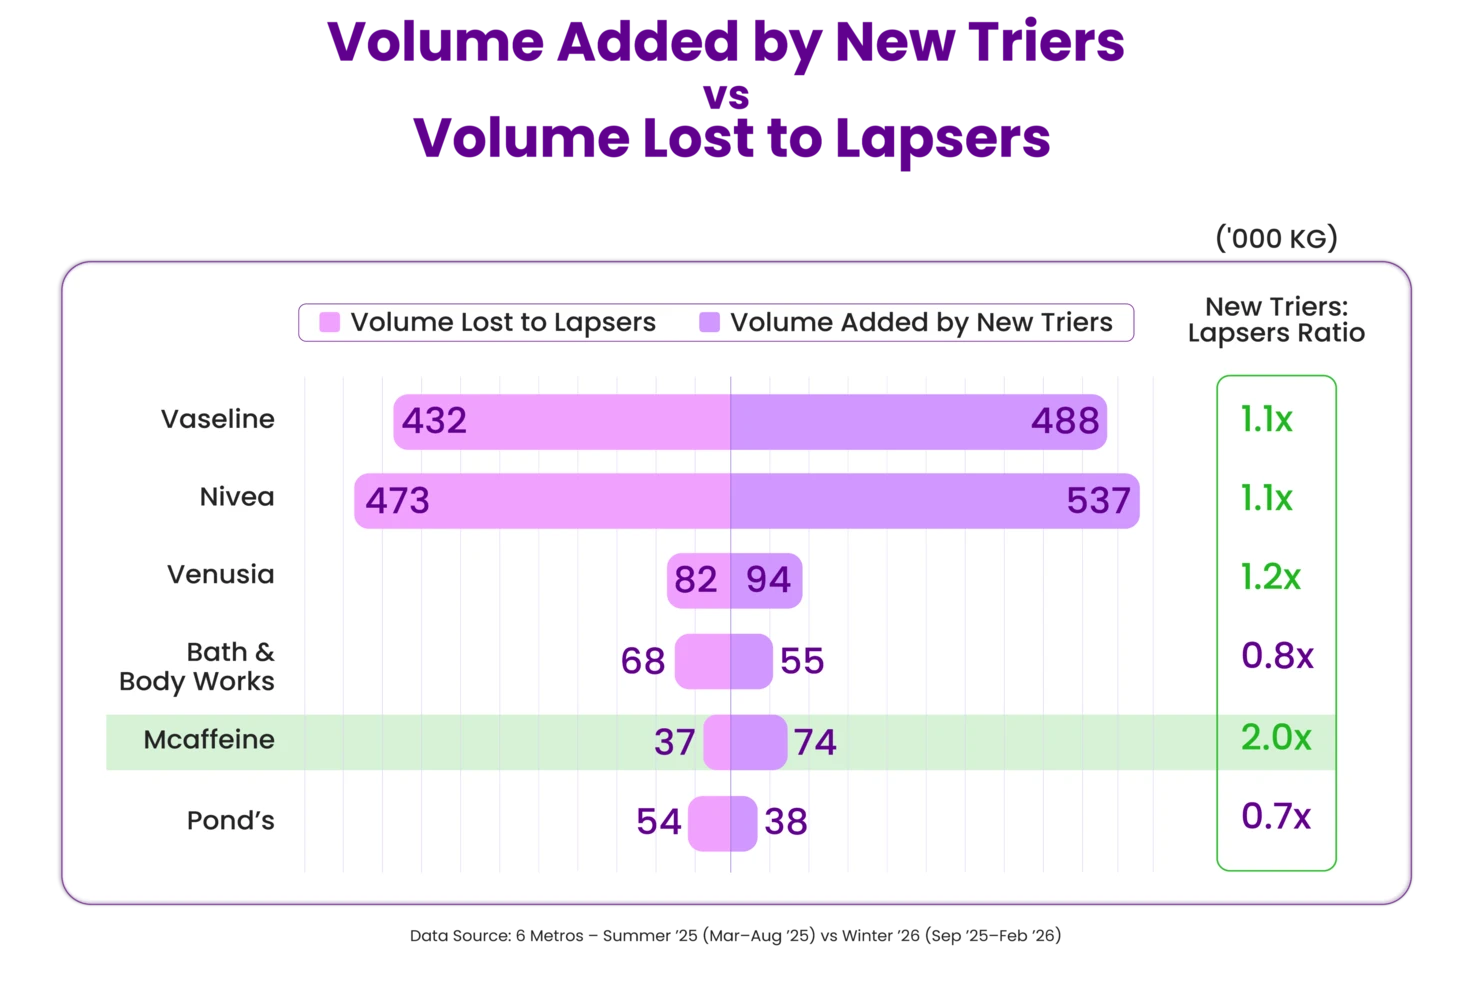
From summer to winter, Nivea, Vaseline and Venusia gain more volume from new consuming households than they lose from households that stop consuming these brands. Mcaffeine stands out, gaining nearly twice as much volume as it loses. In contrast, Pond’s and Bath & Body Works lose more volume than they gain through household entry and lapsing.
Pack Sizes Show Different Seasonal Patterns
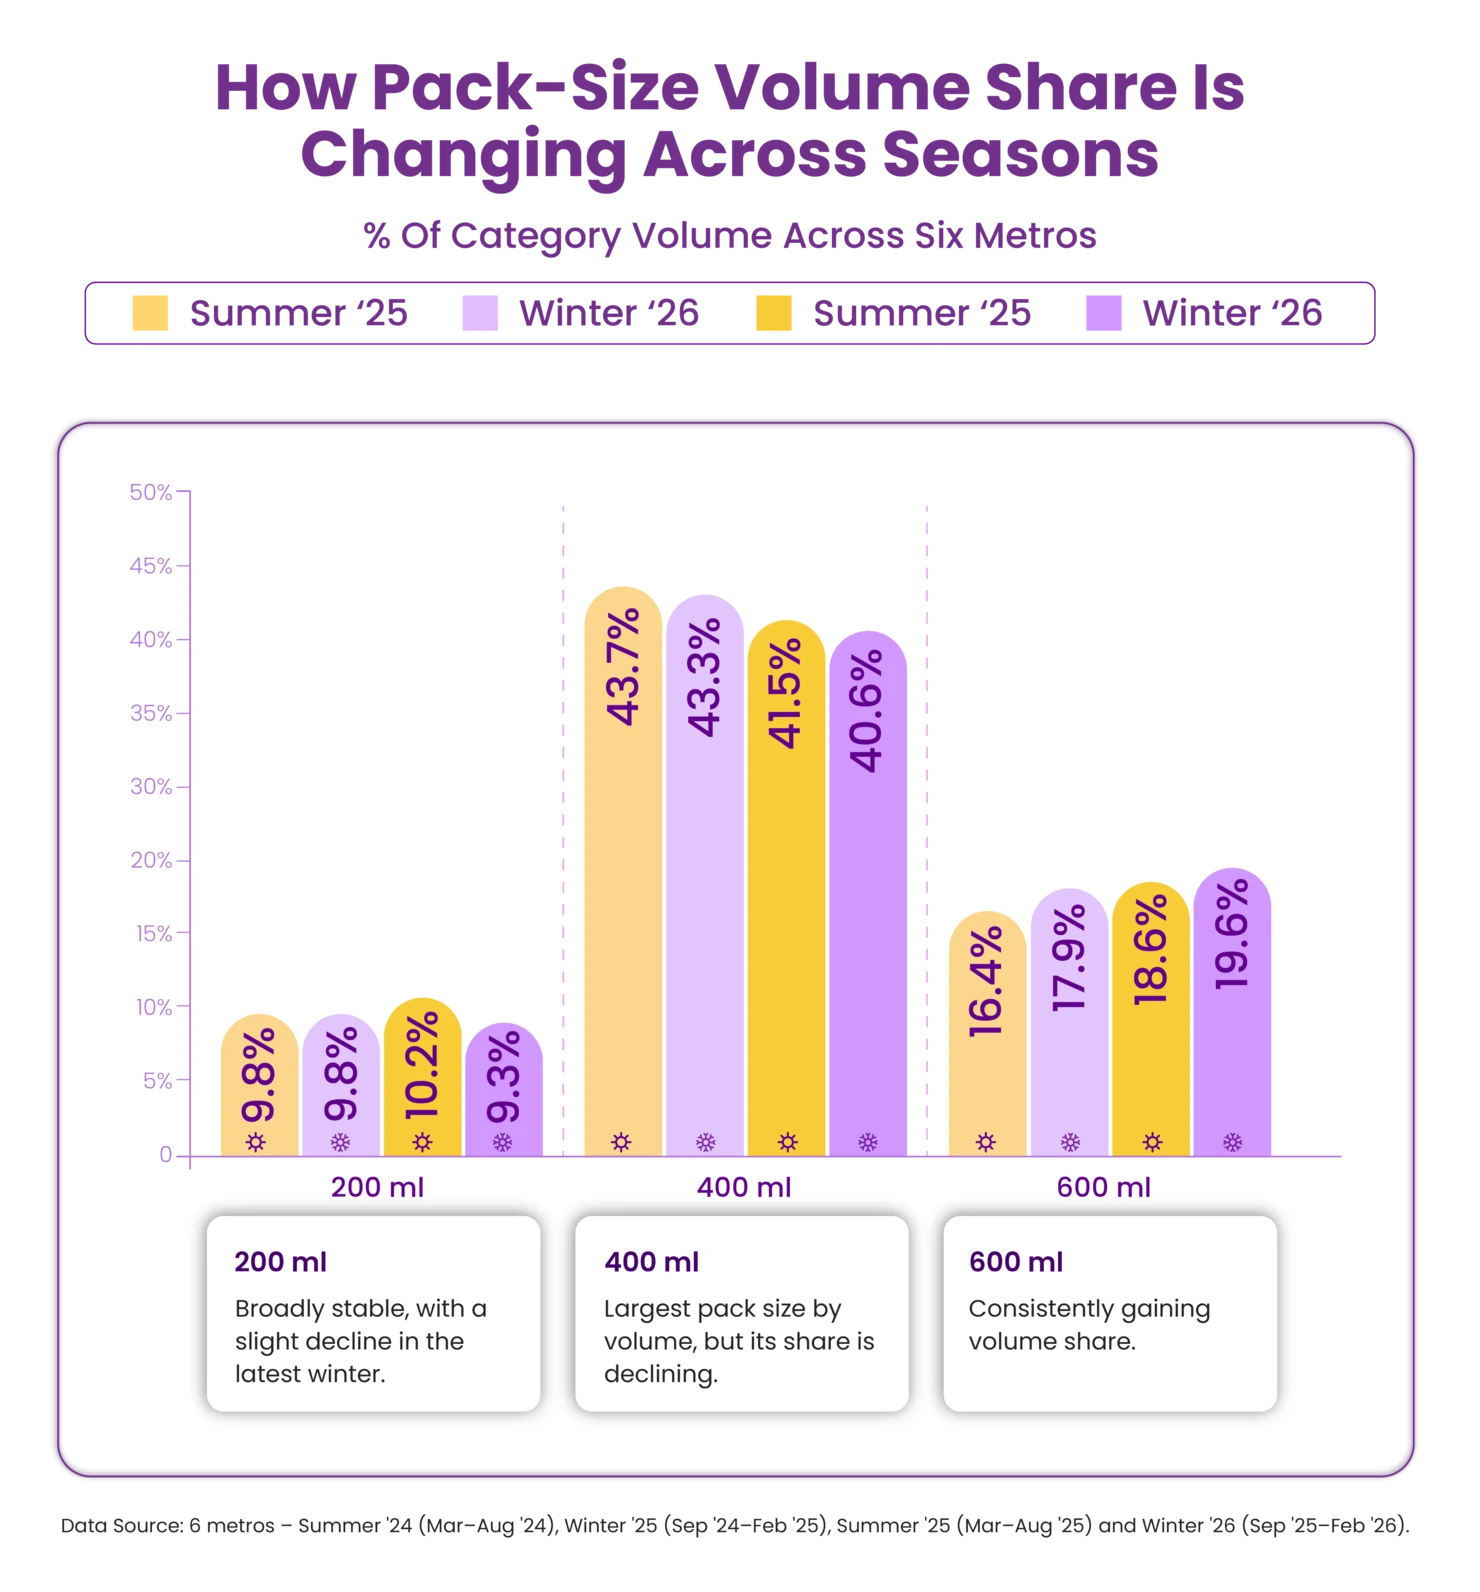
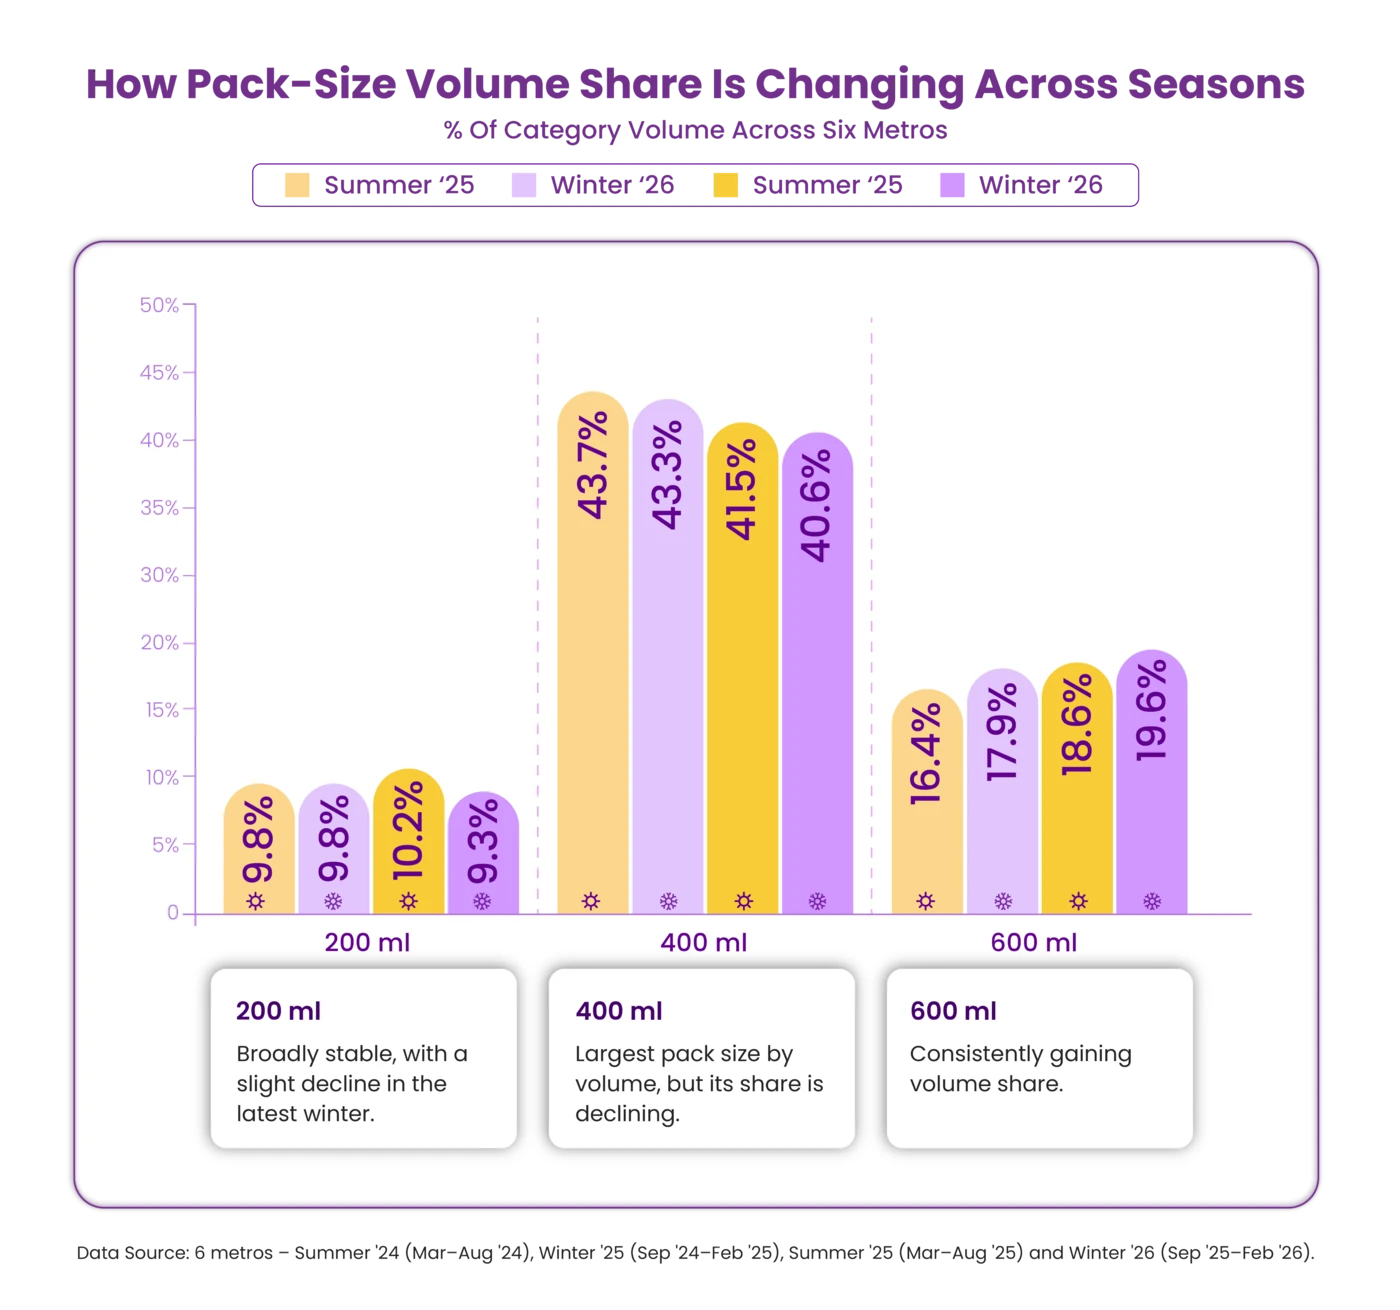
400 ml remains the largest pack size, contributing around 41% of category volume in Winter ’26, although its share has been declining. Meanwhile, 600 ml continues to gain Volume Share across seasons, increasing from 16.4% to 19.6%. In comparison, 200 ml has remained relatively stable, with a slight decline in the latest winter.
What This Means
Body Lotions & Creams is reaching more households outside winter, even as winter remains the stronger season and seasonal differences remain across cities, brands and pack sizes. For brands, the opportunity is to understand which households continue consuming beyond winter and what helps sustain that consumption.
Learn More
Exclusive Read of India-A Homes: Walled Garden Consumers
Exclusive Read of India-A Homes: Walled Garden Consumers
40%
Of Urban Metro Population

48%
Of Urban Metro Consumption
22 Million
People In 6 Metros

5x
Consumption Of
Chocolates
5x
Spends On
Face Creams

22 Million
People In 6 Metros
5x
Consumption Of
Chocolates
5x
Spends On
Face Creams
1/3
Are Online Shoppers &
Use International Brands

45%
Consume Organic
Staples
2x
Spends On Hair Care

1/3
Are Online Shoppers &
Use International Brands
45%
Consume Organic
Staples
2x
Spends On Hair Care
22 Million
People In 6 Metros
5x
Consumption Of
Chocolates
5x
Spends On
Face Creams
1/3
Are Online Shoppers &
Use International Brands
45%
Consume Organic
Staples
2x
Spends On Hair Care
Get In Touch
Please enter details and we will get back to you